Parasphingopyxis lamellibrachiae
Taxonomy: cellular organisms; Bacteria; Proteobacteria; Alphaproteobacteria; Sphingomonadales; Sphingomonadaceae; Parasphingopyxis
Average proteome isoelectric point is 5.86
Get precalculated fractions of proteins

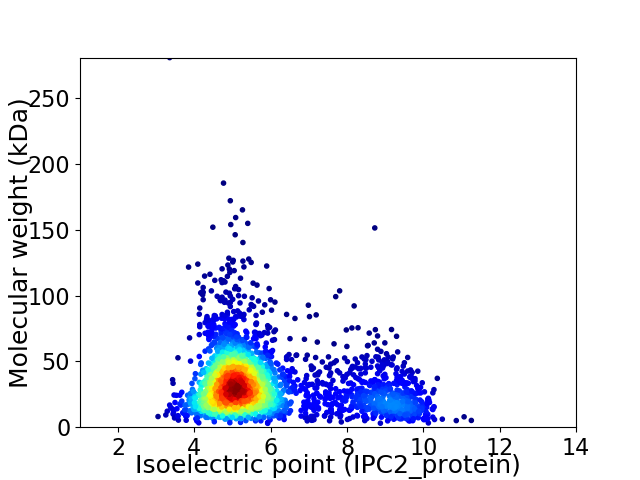
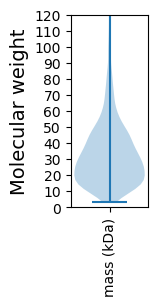
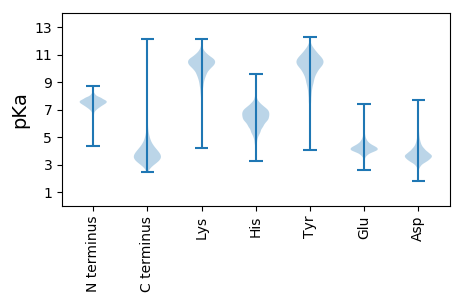
Virtual 2D-PAGE plot for 2877 proteins (isoelectric point calculated using IPC2_protein)
Get csv file with sequences according to given criteria:
* You can choose from 21 different methods for calculating isoelectric point
Summary statistics related to proteome-wise predictions


Protein with the lowest isoelectric point:
>tr|A0A3D9FGT6|A0A3D9FGT6_9SPHN DNA helicase OS=Parasphingopyxis lamellibrachiae OX=680125 GN=DFR46_2064 PE=3 SV=1
MM1 pKa = 7.31KK2 pKa = 9.82RR3 pKa = 11.84HH4 pKa = 6.17SIINFATVAMSGALLAACGGTAPDD28 pKa = 4.07EE29 pKa = 4.43PVEE32 pKa = 4.29EE33 pKa = 4.32PAVEE37 pKa = 4.14VEE39 pKa = 4.55PLADD43 pKa = 3.63ACPDD47 pKa = 3.13RR48 pKa = 11.84VQDD51 pKa = 3.72MRR53 pKa = 11.84GSTDD57 pKa = 4.7AFTCSCSTEE66 pKa = 3.93TAEE69 pKa = 6.13AGTVWGAGPYY79 pKa = 9.95SDD81 pKa = 5.82DD82 pKa = 4.17SAVCRR87 pKa = 11.84AAMHH91 pKa = 6.61AGLVGDD97 pKa = 4.56EE98 pKa = 4.35PANVTINFMDD108 pKa = 3.89GRR110 pKa = 11.84DD111 pKa = 3.46SYY113 pKa = 10.79TASEE117 pKa = 4.3ANGVEE122 pKa = 4.1TRR124 pKa = 11.84QWGSWGGSFAFEE136 pKa = 4.04GAEE139 pKa = 3.85LGEE142 pKa = 4.29PEE144 pKa = 4.48GEE146 pKa = 3.76EE147 pKa = 3.93TAALEE152 pKa = 4.32ACPGNARR159 pKa = 11.84QLRR162 pKa = 11.84GTEE165 pKa = 3.9EE166 pKa = 4.41AVQCSCTAQATEE178 pKa = 5.28DD179 pKa = 3.73GTVWGSGTYY188 pKa = 9.76TDD190 pKa = 4.75DD191 pKa = 4.77SGVCRR196 pKa = 11.84AALHH200 pKa = 6.11AGIVTGDD207 pKa = 3.47GGDD210 pKa = 3.43VTFTIVDD217 pKa = 3.85GQEE220 pKa = 4.09SYY222 pKa = 11.07SGSEE226 pKa = 3.93ANGVEE231 pKa = 4.03SRR233 pKa = 11.84DD234 pKa = 3.48YY235 pKa = 10.95GAWSGSFEE243 pKa = 4.41FEE245 pKa = 4.5DD246 pKa = 5.01DD247 pKa = 3.58KK248 pKa = 11.99GG249 pKa = 3.61
MM1 pKa = 7.31KK2 pKa = 9.82RR3 pKa = 11.84HH4 pKa = 6.17SIINFATVAMSGALLAACGGTAPDD28 pKa = 4.07EE29 pKa = 4.43PVEE32 pKa = 4.29EE33 pKa = 4.32PAVEE37 pKa = 4.14VEE39 pKa = 4.55PLADD43 pKa = 3.63ACPDD47 pKa = 3.13RR48 pKa = 11.84VQDD51 pKa = 3.72MRR53 pKa = 11.84GSTDD57 pKa = 4.7AFTCSCSTEE66 pKa = 3.93TAEE69 pKa = 6.13AGTVWGAGPYY79 pKa = 9.95SDD81 pKa = 5.82DD82 pKa = 4.17SAVCRR87 pKa = 11.84AAMHH91 pKa = 6.61AGLVGDD97 pKa = 4.56EE98 pKa = 4.35PANVTINFMDD108 pKa = 3.89GRR110 pKa = 11.84DD111 pKa = 3.46SYY113 pKa = 10.79TASEE117 pKa = 4.3ANGVEE122 pKa = 4.1TRR124 pKa = 11.84QWGSWGGSFAFEE136 pKa = 4.04GAEE139 pKa = 3.85LGEE142 pKa = 4.29PEE144 pKa = 4.48GEE146 pKa = 3.76EE147 pKa = 3.93TAALEE152 pKa = 4.32ACPGNARR159 pKa = 11.84QLRR162 pKa = 11.84GTEE165 pKa = 3.9EE166 pKa = 4.41AVQCSCTAQATEE178 pKa = 5.28DD179 pKa = 3.73GTVWGSGTYY188 pKa = 9.76TDD190 pKa = 4.75DD191 pKa = 4.77SGVCRR196 pKa = 11.84AALHH200 pKa = 6.11AGIVTGDD207 pKa = 3.47GGDD210 pKa = 3.43VTFTIVDD217 pKa = 3.85GQEE220 pKa = 4.09SYY222 pKa = 11.07SGSEE226 pKa = 3.93ANGVEE231 pKa = 4.03SRR233 pKa = 11.84DD234 pKa = 3.48YY235 pKa = 10.95GAWSGSFEE243 pKa = 4.41FEE245 pKa = 4.5DD246 pKa = 5.01DD247 pKa = 3.58KK248 pKa = 11.99GG249 pKa = 3.61
Molecular weight: 25.72 kDa
Isoelectric point according different methods:
Protein with the highest isoelectric point:
>tr|A0A3D9FCI2|A0A3D9FCI2_9SPHN Beta-carotene hydroxylase OS=Parasphingopyxis lamellibrachiae OX=680125 GN=DFR46_0280 PE=4 SV=1
MM1 pKa = 7.45KK2 pKa = 9.61RR3 pKa = 11.84TFQPSNLVRR12 pKa = 11.84KK13 pKa = 9.18RR14 pKa = 11.84RR15 pKa = 11.84HH16 pKa = 4.51GFRR19 pKa = 11.84ARR21 pKa = 11.84KK22 pKa = 7.83ATVGGRR28 pKa = 11.84NVLRR32 pKa = 11.84ARR34 pKa = 11.84RR35 pKa = 11.84SKK37 pKa = 10.7GRR39 pKa = 11.84KK40 pKa = 8.77KK41 pKa = 10.66LSAA44 pKa = 3.95
MM1 pKa = 7.45KK2 pKa = 9.61RR3 pKa = 11.84TFQPSNLVRR12 pKa = 11.84KK13 pKa = 9.18RR14 pKa = 11.84RR15 pKa = 11.84HH16 pKa = 4.51GFRR19 pKa = 11.84ARR21 pKa = 11.84KK22 pKa = 7.83ATVGGRR28 pKa = 11.84NVLRR32 pKa = 11.84ARR34 pKa = 11.84RR35 pKa = 11.84SKK37 pKa = 10.7GRR39 pKa = 11.84KK40 pKa = 8.77KK41 pKa = 10.66LSAA44 pKa = 3.95
Molecular weight: 5.13 kDa
Isoelectric point according different methods:
Peptides (in silico digests for buttom-up proteomics)
Below you can find in silico digests of the whole proteome with Trypsin, Chymotrypsin, Trypsin+LysC, LysN, ArgC proteases suitable for different mass spec machines.| Try ESI |
 |
|---|
| ChTry ESI |
 |
|---|
| ArgC ESI |
 |
|---|
| LysN ESI |
 |
|---|
| TryLysC ESI |
 |
|---|
| Try MALDI |
 |
|---|
| ChTry MALDI |
 |
|---|
| ArgC MALDI |
 |
|---|
| LysN MALDI |
 |
|---|
| TryLysC MALDI |
 |
|---|
| Try LTQ |
 |
|---|
| ChTry LTQ |
 |
|---|
| ArgC LTQ |
 |
|---|
| LysN LTQ |
 |
|---|
| TryLysC LTQ |
 |
|---|
| Try MSlow |
 |
|---|
| ChTry MSlow |
 |
|---|
| ArgC MSlow |
 |
|---|
| LysN MSlow |
 |
|---|
| TryLysC MSlow |
 |
|---|
| Try MShigh |
 |
|---|
| ChTry MShigh |
 |
|---|
| ArgC MShigh |
 |
|---|
| LysN MShigh |
 |
|---|
| TryLysC MShigh |
 |
|---|
General Statistics
Number of major isoforms |
Number of additional isoforms |
Number of all proteins |
Number of amino acids |
Min. Seq. Length |
Max. Seq. Length |
Avg. Seq. Length |
Avg. Mol. Weight |
|---|---|---|---|---|---|---|---|
0 |
903915 |
29 |
2922 |
314.2 |
34.14 |
Amino acid frequency
Ala |
Cys |
Asp |
Glu |
Phe |
Gly |
His |
Ile |
Lys |
Leu |
|---|---|---|---|---|---|---|---|---|---|
12.306 ± 0.06 | 0.832 ± 0.016 |
6.28 ± 0.035 | 6.444 ± 0.046 |
3.739 ± 0.035 | 8.786 ± 0.053 |
1.97 ± 0.022 | 5.633 ± 0.033 |
2.854 ± 0.045 | 9.529 ± 0.051 |
Met |
Asn |
Gln |
Pro |
Arg |
Ser |
Thr |
Val |
Trp |
Tyr |
|---|---|---|---|---|---|---|---|---|---|
2.574 ± 0.022 | 2.779 ± 0.028 |
5.063 ± 0.031 | 3.035 ± 0.025 |
7.029 ± 0.047 | 5.477 ± 0.033 |
5.251 ± 0.035 | 6.739 ± 0.034 |
1.404 ± 0.021 | 2.276 ± 0.025 |
Most of the basic statistics you can see at this page can be downloaded from this CSV file
Proteome-pI is available under Creative Commons Attribution-NoDerivs license, for more details see here
| Reference: Kozlowski LP. Proteome-pI 2.0: Proteome Isoelectric Point Database Update. Nucleic Acids Res. 2021, doi: 10.1093/nar/gkab944 | Contact: Lukasz P. Kozlowski |
