Salinisphaera japonica YTM-1
Taxonomy: cellular organisms; Bacteria; Proteobacteria; Gammaproteobacteria; Salinisphaerales; Salinisphaeraceae; Salinisphaera; Salinisphaera japonica
Average proteome isoelectric point is 6.28
Get precalculated fractions of proteins
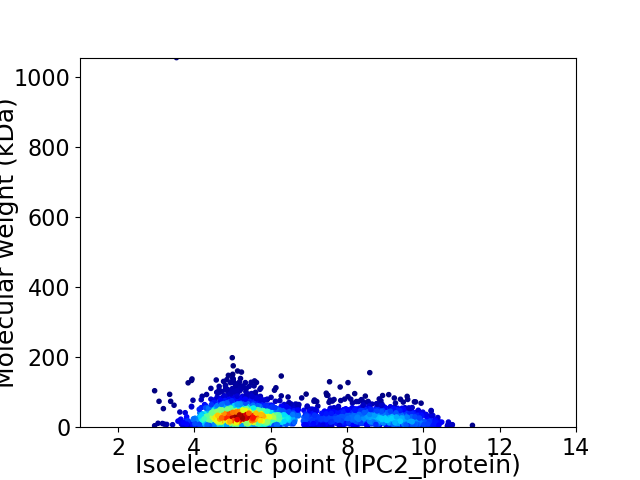
Virtual 2D-PAGE plot for 2932 proteins (isoelectric point calculated using IPC2_protein)
Get csv file with sequences according to given criteria:
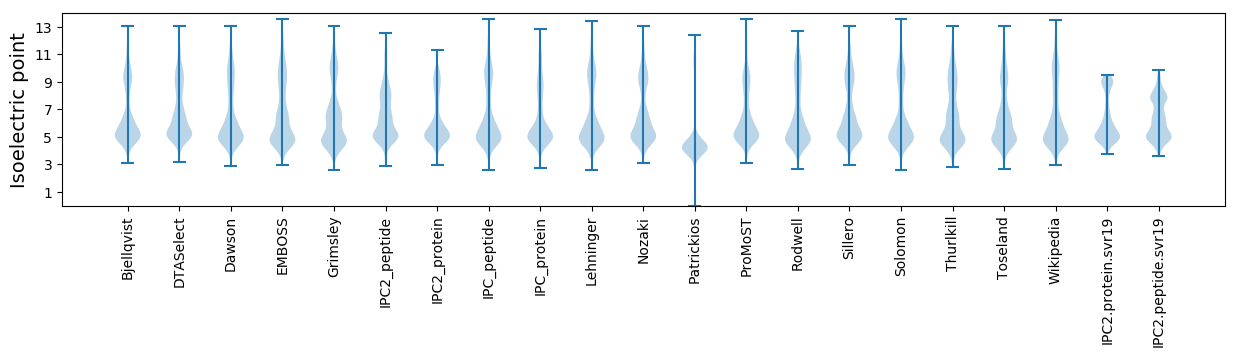
* You can choose from 21 different methods for calculating isoelectric point
Summary statistics related to proteome-wise predictions
Protein with the lowest isoelectric point:
>tr|A0A423PFV1|A0A423PFV1_9GAMM Uncharacterized protein OS=Salinisphaera japonica YTM-1 OX=1209778 GN=SAJA_14245 PE=4 SV=1
MM1 pKa = 7.6LATPVSCRR9 pKa = 11.84GDD11 pKa = 3.51YY12 pKa = 10.8EE13 pKa = 4.12IVRR16 pKa = 11.84TYY18 pKa = 10.94IDD20 pKa = 4.22LCTSGIFEE28 pKa = 6.14FPFDD32 pKa = 4.67WNDD35 pKa = 3.03LDD37 pKa = 3.42IWNDD41 pKa = 3.48PLEE44 pKa = 4.22MSRR47 pKa = 11.84QGGGFILADD56 pKa = 3.85GVNSEE61 pKa = 4.66YY62 pKa = 10.18VTTDD66 pKa = 2.32ISGFKK71 pKa = 10.18LIWVHH76 pKa = 6.72
MM1 pKa = 7.6LATPVSCRR9 pKa = 11.84GDD11 pKa = 3.51YY12 pKa = 10.8EE13 pKa = 4.12IVRR16 pKa = 11.84TYY18 pKa = 10.94IDD20 pKa = 4.22LCTSGIFEE28 pKa = 6.14FPFDD32 pKa = 4.67WNDD35 pKa = 3.03LDD37 pKa = 3.42IWNDD41 pKa = 3.48PLEE44 pKa = 4.22MSRR47 pKa = 11.84QGGGFILADD56 pKa = 3.85GVNSEE61 pKa = 4.66YY62 pKa = 10.18VTTDD66 pKa = 2.32ISGFKK71 pKa = 10.18LIWVHH76 pKa = 6.72
Molecular weight: 8.65 kDa
Isoelectric point according different methods:
Protein with the highest isoelectric point:
>tr|A0A423PZF1|A0A423PZF1_9GAMM Uncharacterized protein OS=Salinisphaera japonica YTM-1 OX=1209778 GN=SAJA_03850 PE=4 SV=1
MM1 pKa = 7.45KK2 pKa = 9.61RR3 pKa = 11.84TFQPSNLRR11 pKa = 11.84RR12 pKa = 11.84KK13 pKa = 8.16RR14 pKa = 11.84THH16 pKa = 5.96GFRR19 pKa = 11.84ARR21 pKa = 11.84MATKK25 pKa = 10.01NGRR28 pKa = 11.84RR29 pKa = 11.84VIAARR34 pKa = 11.84RR35 pKa = 11.84AKK37 pKa = 9.79GRR39 pKa = 11.84KK40 pKa = 9.07RR41 pKa = 11.84LTPP44 pKa = 3.95
MM1 pKa = 7.45KK2 pKa = 9.61RR3 pKa = 11.84TFQPSNLRR11 pKa = 11.84RR12 pKa = 11.84KK13 pKa = 8.16RR14 pKa = 11.84THH16 pKa = 5.96GFRR19 pKa = 11.84ARR21 pKa = 11.84MATKK25 pKa = 10.01NGRR28 pKa = 11.84RR29 pKa = 11.84VIAARR34 pKa = 11.84RR35 pKa = 11.84AKK37 pKa = 9.79GRR39 pKa = 11.84KK40 pKa = 9.07RR41 pKa = 11.84LTPP44 pKa = 3.95
Molecular weight: 5.23 kDa
Isoelectric point according different methods:
Peptides (in silico digests for buttom-up proteomics)
Below you can find in silico digests of the whole proteome with Trypsin, Chymotrypsin, Trypsin+LysC, LysN, ArgC proteases suitable for different mass spec machines.| Try ESI |
 |
|---|
| ChTry ESI |
|
|---|
| ArgC ESI |
|
|---|
| LysN ESI |
|
|---|
| TryLysC ESI |
|
|---|
| Try MALDI |
|
|---|
| ChTry MALDI |
|
|---|
| ArgC MALDI |
|
|---|
| LysN MALDI |
|
|---|
| TryLysC MALDI |
|
|---|
| Try LTQ |
|
|---|
| ChTry LTQ |
|
|---|
| ArgC LTQ |
|
|---|
| LysN LTQ |
|
|---|
| TryLysC LTQ |
|
|---|
| Try MSlow |
|
|---|
| ChTry MSlow |
|
|---|
| ArgC MSlow |
|
|---|
| LysN MSlow |
|
|---|
| TryLysC MSlow |
|
|---|
| Try MShigh |
|
|---|
| ChTry MShigh |
|
|---|
| ArgC MShigh |
|
|---|
| LysN MShigh |
|
|---|
| TryLysC MShigh |
|
|---|
General Statistics
Number of major isoforms |
Number of additional isoforms |
Number of all proteins |
Number of amino acids |
Min. Seq. Length |
Max. Seq. Length |
Avg. Seq. Length |
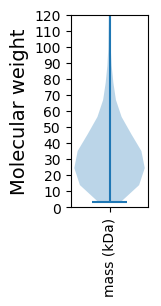
Avg. Mol. Weight |
|---|---|---|---|---|---|---|---|
0 |
946517 |
29 |
10462 |
322.8 |
34.99 |
Amino acid frequency
Ala |
Cys |
Asp |
Glu |
Phe |
Gly |
His |
Ile |
Lys |
Leu |
|---|---|---|---|---|---|---|---|---|---|
13.335 ± 0.067 | 0.889 ± 0.016 |
6.695 ± 0.063 | 5.067 ± 0.052 |
3.403 ± 0.028 | 8.377 ± 0.061 |
2.317 ± 0.034 | 5.088 ± 0.028 |
2.631 ± 0.049 | 9.827 ± 0.07 |
Met |
Asn |
Gln |
Pro |
Arg |
Ser |
Thr |
Val |
Trp |
Tyr |
|---|---|---|---|---|---|---|---|---|---|
2.337 ± 0.026 | 2.789 ± 0.045 |
4.796 ± 0.032 | 3.48 ± 0.03 |
7.113 ± 0.056 | 5.07 ± 0.037 |
5.614 ± 0.064 | 7.269 ± 0.041 |
1.391 ± 0.023 | 2.512 ± 0.022 |
Most of the basic statistics you can see at this page can be downloaded from this CSV file
See this proteome in:

Proteome-pI is available under Creative Commons Attribution-NoDerivs license, for more details see here
| Reference: Kozlowski LP. Proteome-pI 2.0: Proteome Isoelectric Point Database Update. Nucleic Acids Res. 2021, doi: 10.1093/nar/gkab944 | Contact: Lukasz P. Kozlowski |