Capybara microvirus Cap3_SP_431
Taxonomy: Viruses; Monodnaviria; Sangervirae; Phixviricota; Malgrandaviricetes; Petitvirales; Microviridae; unclassified Microviridae
Average proteome isoelectric point is 6.96
Get precalculated fractions of proteins

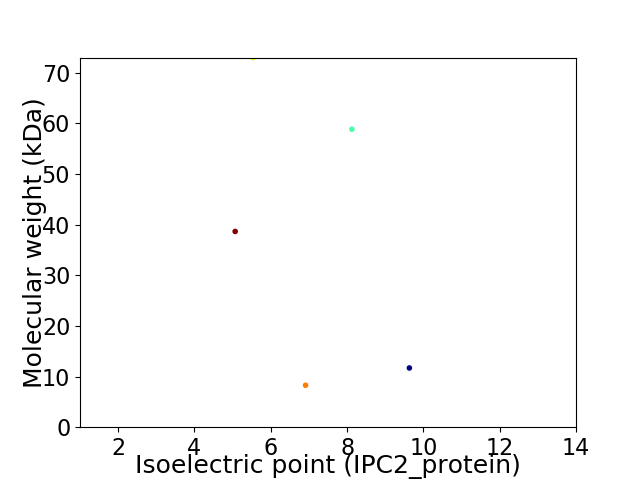
Virtual 2D-PAGE plot for 5 proteins (isoelectric point calculated using IPC2_protein)
Get csv file with sequences according to given criteria:
* You can choose from 21 different methods for calculating isoelectric point
Summary statistics related to proteome-wise predictions


Protein with the lowest isoelectric point:
>tr|A0A4P8W5V6|A0A4P8W5V6_9VIRU Replication initiator protein OS=Capybara microvirus Cap3_SP_431 OX=2585450 PE=4 SV=1
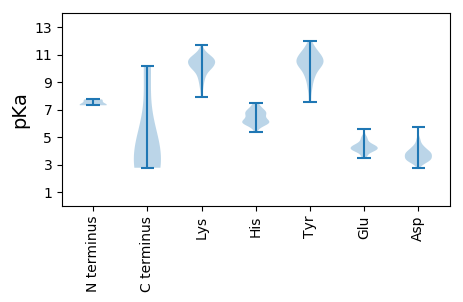
MM1 pKa = 7.66INEE4 pKa = 4.1VTSIDD9 pKa = 3.88NNNINNNIRR18 pKa = 11.84DD19 pKa = 3.69SATAGEE25 pKa = 5.07LIDD28 pKa = 4.9SPSMQNNGTAWLGTALAIAGLVGGTISTAVSNRR61 pKa = 11.84KK62 pKa = 8.85NRR64 pKa = 11.84DD65 pKa = 3.26YY66 pKa = 11.64AEE68 pKa = 4.2EE69 pKa = 3.98QQEE72 pKa = 4.27KK73 pKa = 10.02ANEE76 pKa = 4.15YY77 pKa = 7.66NTPAQQRR84 pKa = 11.84ARR86 pKa = 11.84LEE88 pKa = 3.99EE89 pKa = 4.56AGINPLAGGMSNSLSQPVSSPNQDD113 pKa = 2.78PTANAVSLASMLNGLALQKK132 pKa = 9.94STIKK136 pKa = 10.24LTDD139 pKa = 3.49AQSEE143 pKa = 4.34KK144 pKa = 10.12MQAEE148 pKa = 4.17TRR150 pKa = 11.84NIEE153 pKa = 4.01AQTASTSATLPFVLDD168 pKa = 4.24DD169 pKa = 4.35LQQKK173 pKa = 10.06LLIGNSSLQLSKK185 pKa = 11.11EE186 pKa = 3.65QLDD189 pKa = 3.93YY190 pKa = 11.54VRR192 pKa = 11.84SQTHH196 pKa = 6.99LLNKK200 pKa = 9.1QIEE203 pKa = 4.52WFDD206 pKa = 3.44QQQNRR211 pKa = 11.84EE212 pKa = 4.14SARR215 pKa = 11.84LGLEE219 pKa = 3.61QATAAFNRR227 pKa = 11.84KK228 pKa = 8.11NQTQLTEE235 pKa = 4.47LEE237 pKa = 4.03FAKK240 pKa = 10.71QKK242 pKa = 8.59FTEE245 pKa = 4.1YY246 pKa = 10.62LGEE249 pKa = 4.17NEE251 pKa = 4.32VAKK254 pKa = 10.17TRR256 pKa = 11.84AEE258 pKa = 3.85NAKK261 pKa = 9.49IQHH264 pKa = 6.14EE265 pKa = 4.59SDD267 pKa = 4.13LLLQQFIQGEE277 pKa = 4.41PLTRR281 pKa = 11.84AYY283 pKa = 10.69RR284 pKa = 11.84NYY286 pKa = 10.73ADD288 pKa = 4.11AVYY291 pKa = 9.55EE292 pKa = 4.24SRR294 pKa = 11.84VADD297 pKa = 3.31IATEE301 pKa = 4.27SIEE304 pKa = 4.15SQGAKK309 pKa = 9.61KK310 pKa = 10.12AAEE313 pKa = 4.11IKK315 pKa = 10.79SSVKK319 pKa = 9.9GSAYY323 pKa = 9.88GKK325 pKa = 8.89TMEE328 pKa = 4.33YY329 pKa = 9.5TNDD332 pKa = 3.54VIEE335 pKa = 5.0SIPLLGDD342 pKa = 3.55LLKK345 pKa = 10.82FLSKK349 pKa = 10.29FAKK352 pKa = 10.2
MM1 pKa = 7.66INEE4 pKa = 4.1VTSIDD9 pKa = 3.88NNNINNNIRR18 pKa = 11.84DD19 pKa = 3.69SATAGEE25 pKa = 5.07LIDD28 pKa = 4.9SPSMQNNGTAWLGTALAIAGLVGGTISTAVSNRR61 pKa = 11.84KK62 pKa = 8.85NRR64 pKa = 11.84DD65 pKa = 3.26YY66 pKa = 11.64AEE68 pKa = 4.2EE69 pKa = 3.98QQEE72 pKa = 4.27KK73 pKa = 10.02ANEE76 pKa = 4.15YY77 pKa = 7.66NTPAQQRR84 pKa = 11.84ARR86 pKa = 11.84LEE88 pKa = 3.99EE89 pKa = 4.56AGINPLAGGMSNSLSQPVSSPNQDD113 pKa = 2.78PTANAVSLASMLNGLALQKK132 pKa = 9.94STIKK136 pKa = 10.24LTDD139 pKa = 3.49AQSEE143 pKa = 4.34KK144 pKa = 10.12MQAEE148 pKa = 4.17TRR150 pKa = 11.84NIEE153 pKa = 4.01AQTASTSATLPFVLDD168 pKa = 4.24DD169 pKa = 4.35LQQKK173 pKa = 10.06LLIGNSSLQLSKK185 pKa = 11.11EE186 pKa = 3.65QLDD189 pKa = 3.93YY190 pKa = 11.54VRR192 pKa = 11.84SQTHH196 pKa = 6.99LLNKK200 pKa = 9.1QIEE203 pKa = 4.52WFDD206 pKa = 3.44QQQNRR211 pKa = 11.84EE212 pKa = 4.14SARR215 pKa = 11.84LGLEE219 pKa = 3.61QATAAFNRR227 pKa = 11.84KK228 pKa = 8.11NQTQLTEE235 pKa = 4.47LEE237 pKa = 4.03FAKK240 pKa = 10.71QKK242 pKa = 8.59FTEE245 pKa = 4.1YY246 pKa = 10.62LGEE249 pKa = 4.17NEE251 pKa = 4.32VAKK254 pKa = 10.17TRR256 pKa = 11.84AEE258 pKa = 3.85NAKK261 pKa = 9.49IQHH264 pKa = 6.14EE265 pKa = 4.59SDD267 pKa = 4.13LLLQQFIQGEE277 pKa = 4.41PLTRR281 pKa = 11.84AYY283 pKa = 10.69RR284 pKa = 11.84NYY286 pKa = 10.73ADD288 pKa = 4.11AVYY291 pKa = 9.55EE292 pKa = 4.24SRR294 pKa = 11.84VADD297 pKa = 3.31IATEE301 pKa = 4.27SIEE304 pKa = 4.15SQGAKK309 pKa = 9.61KK310 pKa = 10.12AAEE313 pKa = 4.11IKK315 pKa = 10.79SSVKK319 pKa = 9.9GSAYY323 pKa = 9.88GKK325 pKa = 8.89TMEE328 pKa = 4.33YY329 pKa = 9.5TNDD332 pKa = 3.54VIEE335 pKa = 5.0SIPLLGDD342 pKa = 3.55LLKK345 pKa = 10.82FLSKK349 pKa = 10.29FAKK352 pKa = 10.2
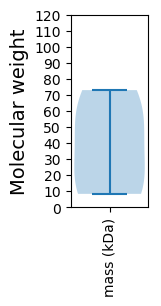
Molecular weight: 38.64 kDa
Isoelectric point according different methods:
Protein with the highest isoelectric point:
>tr|A0A4V1FVT2|A0A4V1FVT2_9VIRU Uncharacterized protein OS=Capybara microvirus Cap3_SP_431 OX=2585450 PE=4 SV=1
MM1 pKa = 7.37GKK3 pKa = 9.88KK4 pKa = 10.07VDD6 pKa = 4.21DD7 pKa = 4.25ATLSTCVGGKK17 pKa = 9.6RR18 pKa = 11.84FPPTSPIARR27 pKa = 11.84SGPGGRR33 pKa = 11.84LLSMCKK39 pKa = 9.84GRR41 pKa = 11.84QKK43 pKa = 10.7GRR45 pKa = 11.84EE46 pKa = 3.75RR47 pKa = 11.84NKK49 pKa = 10.54RR50 pKa = 11.84KK51 pKa = 9.92SLPIKK56 pKa = 10.4NKK58 pKa = 9.14WSLKK62 pKa = 9.89RR63 pKa = 11.84DD64 pKa = 3.65AEE66 pKa = 4.43LGAHH70 pKa = 6.73LAVDD74 pKa = 4.82GVSEE78 pKa = 4.34LVSQFLVFVRR88 pKa = 11.84KK89 pKa = 10.31SKK91 pKa = 11.26DD92 pKa = 3.31FLTKK96 pKa = 10.08TSAWYY101 pKa = 9.39QWVVV105 pKa = 2.77
MM1 pKa = 7.37GKK3 pKa = 9.88KK4 pKa = 10.07VDD6 pKa = 4.21DD7 pKa = 4.25ATLSTCVGGKK17 pKa = 9.6RR18 pKa = 11.84FPPTSPIARR27 pKa = 11.84SGPGGRR33 pKa = 11.84LLSMCKK39 pKa = 9.84GRR41 pKa = 11.84QKK43 pKa = 10.7GRR45 pKa = 11.84EE46 pKa = 3.75RR47 pKa = 11.84NKK49 pKa = 10.54RR50 pKa = 11.84KK51 pKa = 9.92SLPIKK56 pKa = 10.4NKK58 pKa = 9.14WSLKK62 pKa = 9.89RR63 pKa = 11.84DD64 pKa = 3.65AEE66 pKa = 4.43LGAHH70 pKa = 6.73LAVDD74 pKa = 4.82GVSEE78 pKa = 4.34LVSQFLVFVRR88 pKa = 11.84KK89 pKa = 10.31SKK91 pKa = 11.26DD92 pKa = 3.31FLTKK96 pKa = 10.08TSAWYY101 pKa = 9.39QWVVV105 pKa = 2.77
Molecular weight: 11.69 kDa
Isoelectric point according different methods:
Peptides (in silico digests for buttom-up proteomics)
Below you can find in silico digests of the whole proteome with Trypsin, Chymotrypsin, Trypsin+LysC, LysN, ArgC proteases suitable for different mass spec machines.| Try ESI |
 |
|---|
| ChTry ESI |
 |
|---|
| ArgC ESI |
 |
|---|
| LysN ESI |
 |
|---|
| TryLysC ESI |
 |
|---|
| Try MALDI |
 |
|---|
| ChTry MALDI |
 |
|---|
| ArgC MALDI |
 |
|---|
| LysN MALDI |
 |
|---|
| TryLysC MALDI |
 |
|---|
| Try LTQ |
 |
|---|
| ChTry LTQ |
 |
|---|
| ArgC LTQ |
 |
|---|
| LysN LTQ |
 |
|---|
| TryLysC LTQ |
 |
|---|
| Try MSlow |
 |
|---|
| ChTry MSlow |
 |
|---|
| ArgC MSlow |
 |
|---|
| LysN MSlow |
 |
|---|
| TryLysC MSlow |
 |
|---|
| Try MShigh |
 |
|---|
| ChTry MShigh |
 |
|---|
| ArgC MShigh |
 |
|---|
| LysN MShigh |
 |
|---|
| TryLysC MShigh |
 |
|---|
General Statistics
Number of major isoforms |
Number of additional isoforms |
Number of all proteins |
Number of amino acids |
Min. Seq. Length |
Max. Seq. Length |
Avg. Seq. Length |
Avg. Mol. Weight |
|---|---|---|---|---|---|---|---|
0 |
1668 |
74 |
643 |
333.6 |
38.08 |
Amino acid frequency
Ala |
Cys |
Asp |
Glu |
Phe |
Gly |
His |
Ile |
Lys |
Leu |
|---|---|---|---|---|---|---|---|---|---|
5.935 ± 1.776 | 1.559 ± 0.41 |
5.935 ± 0.562 | 5.096 ± 0.818 |
4.796 ± 0.711 | 5.396 ± 0.403 |
2.518 ± 0.983 | 5.336 ± 0.829 |
6.175 ± 0.831 | 10.192 ± 0.158 |
Met |
Asn |
Gln |
Pro |
Arg |
Ser |
Thr |
Val |
Trp |
Tyr |
|---|---|---|---|---|---|---|---|---|---|
1.379 ± 0.152 | 7.134 ± 0.531 |
3.477 ± 0.353 | 4.676 ± 0.964 |
5.216 ± 0.432 | 7.914 ± 0.697 |
5.875 ± 0.858 | 5.036 ± 0.64 |
0.54 ± 0.245 | 5.815 ± 1.462 |
Most of the basic statistics you can see at this page can be downloaded from this CSV file
Proteome-pI is available under Creative Commons Attribution-NoDerivs license, for more details see here
| Reference: Kozlowski LP. Proteome-pI 2.0: Proteome Isoelectric Point Database Update. Nucleic Acids Res. 2021, doi: 10.1093/nar/gkab944 | Contact: Lukasz P. Kozlowski |
