Salmonella phage 64795_sal3
Taxonomy: Viruses; Duplodnaviria; Heunggongvirae; Uroviricota; Caudoviricetes; Caudovirales; Siphoviridae; unclassified Siphoviridae
Average proteome isoelectric point is 6.5
Get precalculated fractions of proteins
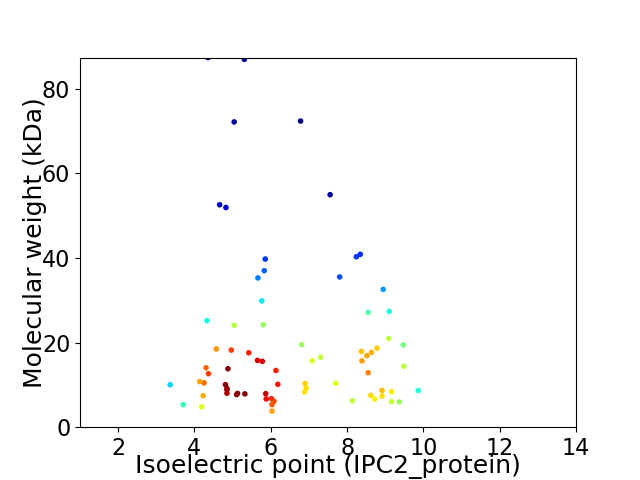
Virtual 2D-PAGE plot for 74 proteins (isoelectric point calculated using IPC2_protein)
Get csv file with sequences according to given criteria:
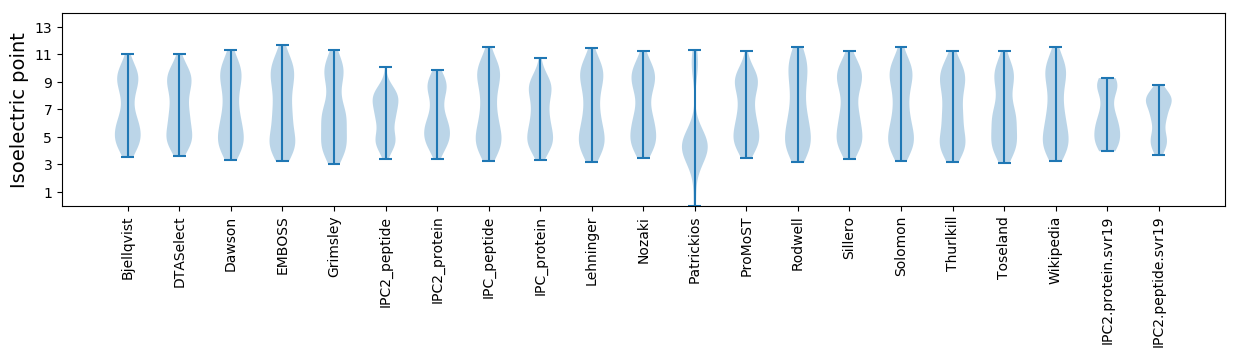
* You can choose from 21 different methods for calculating isoelectric point
Summary statistics related to proteome-wise predictions
Protein with the lowest isoelectric point:
>tr|A0A173GCU5|A0A173GCU5_9CAUD Uncharacterized protein OS=Salmonella phage 64795_sal3 OX=1813769 PE=4 SV=1
MM1 pKa = 7.84IPLLWILSAYY11 pKa = 10.12AFARR15 pKa = 11.84VFEE18 pKa = 4.69ADD20 pKa = 3.27SLYY23 pKa = 11.53QMICYY28 pKa = 9.15GALFCLSGAALAFMDD43 pKa = 5.54DD44 pKa = 4.37VISDD48 pKa = 3.56
MM1 pKa = 7.84IPLLWILSAYY11 pKa = 10.12AFARR15 pKa = 11.84VFEE18 pKa = 4.69ADD20 pKa = 3.27SLYY23 pKa = 11.53QMICYY28 pKa = 9.15GALFCLSGAALAFMDD43 pKa = 5.54DD44 pKa = 4.37VISDD48 pKa = 3.56
Molecular weight: 5.33 kDa
Isoelectric point according different methods:
Protein with the highest isoelectric point:
>tr|A0A173GBX5|A0A173GBX5_9CAUD Uncharacterized protein OS=Salmonella phage 64795_sal3 OX=1813769 PE=4 SV=1
MM1 pKa = 7.87RR2 pKa = 11.84KK3 pKa = 9.85FSTLVDD9 pKa = 5.31LILAEE14 pKa = 4.24EE15 pKa = 4.32SNARR19 pKa = 11.84NKK21 pKa = 10.24KK22 pKa = 9.85SRR24 pKa = 11.84NQRR27 pKa = 11.84QDD29 pKa = 2.32ITFRR33 pKa = 11.84TLLKK37 pKa = 10.41QSMRR41 pKa = 11.84GKK43 pKa = 10.36KK44 pKa = 6.63EE45 pKa = 3.06WRR47 pKa = 11.84YY48 pKa = 10.11RR49 pKa = 11.84RR50 pKa = 11.84DD51 pKa = 3.04RR52 pKa = 11.84VLIKK56 pKa = 10.53LCKK59 pKa = 10.32LNMNKK64 pKa = 8.07TLKK67 pKa = 11.0DD68 pKa = 3.23MTKK71 pKa = 10.71
MM1 pKa = 7.87RR2 pKa = 11.84KK3 pKa = 9.85FSTLVDD9 pKa = 5.31LILAEE14 pKa = 4.24EE15 pKa = 4.32SNARR19 pKa = 11.84NKK21 pKa = 10.24KK22 pKa = 9.85SRR24 pKa = 11.84NQRR27 pKa = 11.84QDD29 pKa = 2.32ITFRR33 pKa = 11.84TLLKK37 pKa = 10.41QSMRR41 pKa = 11.84GKK43 pKa = 10.36KK44 pKa = 6.63EE45 pKa = 3.06WRR47 pKa = 11.84YY48 pKa = 10.11RR49 pKa = 11.84RR50 pKa = 11.84DD51 pKa = 3.04RR52 pKa = 11.84VLIKK56 pKa = 10.53LCKK59 pKa = 10.32LNMNKK64 pKa = 8.07TLKK67 pKa = 11.0DD68 pKa = 3.23MTKK71 pKa = 10.71
Molecular weight: 8.67 kDa
Isoelectric point according different methods:
Peptides (in silico digests for buttom-up proteomics)
Below you can find in silico digests of the whole proteome with Trypsin, Chymotrypsin, Trypsin+LysC, LysN, ArgC proteases suitable for different mass spec machines.| Try ESI |
 |
|---|
| ChTry ESI |
|
|---|
| ArgC ESI |
|
|---|
| LysN ESI |
|
|---|
| TryLysC ESI |
|
|---|
| Try MALDI |
|
|---|
| ChTry MALDI |
|
|---|
| ArgC MALDI |
|
|---|
| LysN MALDI |
|
|---|
| TryLysC MALDI |
|
|---|
| Try LTQ |
|
|---|
| ChTry LTQ |
|
|---|
| ArgC LTQ |
|
|---|
| LysN LTQ |
|
|---|
| TryLysC LTQ |
|
|---|
| Try MSlow |
|
|---|
| ChTry MSlow |
|
|---|
| ArgC MSlow |
|
|---|
| LysN MSlow |
|
|---|
| TryLysC MSlow |
|
|---|
| Try MShigh |
|
|---|
| ChTry MShigh |
|
|---|
| ArgC MShigh |
|
|---|
| LysN MShigh |
|
|---|
| TryLysC MShigh |
|
|---|
General Statistics
Number of major isoforms |
Number of additional isoforms |
Number of all proteins |
Number of amino acids |
Min. Seq. Length |
Max. Seq. Length |
Avg. Seq. Length |
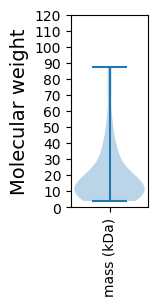
Avg. Mol. Weight |
|---|---|---|---|---|---|---|---|
0 |
13426 |
31 |
828 |
181.4 |
20.31 |
Amino acid frequency
Ala |
Cys |
Asp |
Glu |
Phe |
Gly |
His |
Ile |
Lys |
Leu |
|---|---|---|---|---|---|---|---|---|---|
8.61 ± 0.564 | 1.601 ± 0.2 |
6.316 ± 0.291 | 6.517 ± 0.314 |
3.329 ± 0.177 | 7.15 ± 0.298 |
1.84 ± 0.199 | 6.636 ± 0.186 |
7.217 ± 0.389 | 6.927 ± 0.239 |
Met |
Asn |
Gln |
Pro |
Arg |
Ser |
Thr |
Val |
Trp |
Tyr |
|---|---|---|---|---|---|---|---|---|---|
3.233 ± 0.184 | 4.797 ± 0.202 |
3.143 ± 0.238 | 3.881 ± 0.308 |
5.08 ± 0.232 | 6.428 ± 0.294 |
5.4 ± 0.388 | 6.547 ± 0.257 |
1.564 ± 0.15 | 3.784 ± 0.218 |
Most of the basic statistics you can see at this page can be downloaded from this CSV file
See this proteome in:

Proteome-pI is available under Creative Commons Attribution-NoDerivs license, for more details see here
| Reference: Kozlowski LP. Proteome-pI 2.0: Proteome Isoelectric Point Database Update. Nucleic Acids Res. 2021, doi: 10.1093/nar/gkab944 | Contact: Lukasz P. Kozlowski |