Beet black scorch virus
Taxonomy: Viruses; Riboviria; Orthornavirae; Kitrinoviricota; Tolucaviricetes; Tolivirales; Tombusviridae; Procedovirinae; Betanecrovirus
Average proteome isoelectric point is 8.23
Get precalculated fractions of proteins

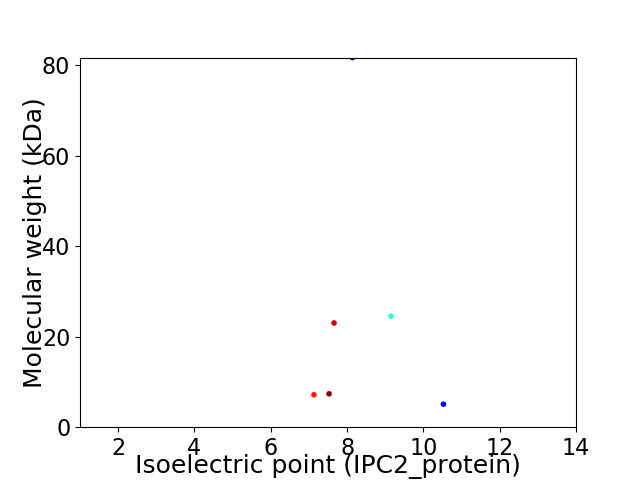
Virtual 2D-PAGE plot for 6 proteins (isoelectric point calculated using IPC2_protein)
Get csv file with sequences according to given criteria:
* You can choose from 21 different methods for calculating isoelectric point
Summary statistics related to proteome-wise predictions


Protein with the lowest isoelectric point:
>tr|Q8B5S0|Q8B5S0_9TOMB RNA-directed RNA polymerase OS=Beet black scorch virus OX=196375 PE=3 SV=2
MM1 pKa = 8.0DD2 pKa = 6.13SIPYY6 pKa = 9.68VILRR10 pKa = 11.84ILDD13 pKa = 4.46FIFHH17 pKa = 6.86SIFFPSLLFIINHH30 pKa = 5.43NTTILWACACAYY42 pKa = 10.09GFYY45 pKa = 10.28RR46 pKa = 11.84AFRR49 pKa = 11.84LIFKK53 pKa = 10.11IKK55 pKa = 10.72VEE57 pKa = 3.86VHH59 pKa = 5.58PATRR63 pKa = 11.84AVFKK67 pKa = 11.36DD68 pKa = 3.05MVTRR72 pKa = 11.84FQRR75 pKa = 11.84EE76 pKa = 4.41SMFSPDD82 pKa = 3.74DD83 pKa = 3.81EE84 pKa = 4.64VPEE87 pKa = 4.98GIPIHH92 pKa = 6.76EE93 pKa = 5.03DD94 pKa = 2.76VDD96 pKa = 4.42LVSDD100 pKa = 4.26PTHH103 pKa = 6.86KK104 pKa = 10.55DD105 pKa = 2.72IKK107 pKa = 10.13RR108 pKa = 11.84VRR110 pKa = 11.84ASRR113 pKa = 11.84RR114 pKa = 11.84VSYY117 pKa = 10.44AVRR120 pKa = 11.84VAHH123 pKa = 5.49VAKK126 pKa = 10.72SKK128 pKa = 11.07VGLLANTKK136 pKa = 10.39ANEE139 pKa = 4.02LVYY142 pKa = 10.99SRR144 pKa = 11.84LCRR147 pKa = 11.84DD148 pKa = 3.16EE149 pKa = 4.24MVTHH153 pKa = 6.71GVRR156 pKa = 11.84PSHH159 pKa = 6.84IAHH162 pKa = 7.05AVPLAVAACFIPLDD176 pKa = 3.96SDD178 pKa = 3.7FLAASIRR185 pKa = 11.84NCDD188 pKa = 3.22EE189 pKa = 3.71MEE191 pKa = 3.87EE192 pKa = 4.05RR193 pKa = 11.84RR194 pKa = 11.84AVLGPSYY201 pKa = 11.22GKK203 pKa = 10.5
MM1 pKa = 8.0DD2 pKa = 6.13SIPYY6 pKa = 9.68VILRR10 pKa = 11.84ILDD13 pKa = 4.46FIFHH17 pKa = 6.86SIFFPSLLFIINHH30 pKa = 5.43NTTILWACACAYY42 pKa = 10.09GFYY45 pKa = 10.28RR46 pKa = 11.84AFRR49 pKa = 11.84LIFKK53 pKa = 10.11IKK55 pKa = 10.72VEE57 pKa = 3.86VHH59 pKa = 5.58PATRR63 pKa = 11.84AVFKK67 pKa = 11.36DD68 pKa = 3.05MVTRR72 pKa = 11.84FQRR75 pKa = 11.84EE76 pKa = 4.41SMFSPDD82 pKa = 3.74DD83 pKa = 3.81EE84 pKa = 4.64VPEE87 pKa = 4.98GIPIHH92 pKa = 6.76EE93 pKa = 5.03DD94 pKa = 2.76VDD96 pKa = 4.42LVSDD100 pKa = 4.26PTHH103 pKa = 6.86KK104 pKa = 10.55DD105 pKa = 2.72IKK107 pKa = 10.13RR108 pKa = 11.84VRR110 pKa = 11.84ASRR113 pKa = 11.84RR114 pKa = 11.84VSYY117 pKa = 10.44AVRR120 pKa = 11.84VAHH123 pKa = 5.49VAKK126 pKa = 10.72SKK128 pKa = 11.07VGLLANTKK136 pKa = 10.39ANEE139 pKa = 4.02LVYY142 pKa = 10.99SRR144 pKa = 11.84LCRR147 pKa = 11.84DD148 pKa = 3.16EE149 pKa = 4.24MVTHH153 pKa = 6.71GVRR156 pKa = 11.84PSHH159 pKa = 6.84IAHH162 pKa = 7.05AVPLAVAACFIPLDD176 pKa = 3.96SDD178 pKa = 3.7FLAASIRR185 pKa = 11.84NCDD188 pKa = 3.22EE189 pKa = 3.71MEE191 pKa = 3.87EE192 pKa = 4.05RR193 pKa = 11.84RR194 pKa = 11.84AVLGPSYY201 pKa = 11.22GKK203 pKa = 10.5
Molecular weight: 23.05 kDa
Isoelectric point according different methods:
Protein with the highest isoelectric point:
>tr|Q8B5R9|Q8B5R9_9TOMB RNA-directed RNA polymerase OS=Beet black scorch virus OX=196375 GN=ORF1 PE=4 SV=1
MM1 pKa = 7.32NRR3 pKa = 11.84LPWRR7 pKa = 11.84MGFLVSALISWTRR20 pKa = 11.84TPRR23 pKa = 11.84RR24 pKa = 11.84RR25 pKa = 11.84SASSSSLGHH34 pKa = 6.28EE35 pKa = 4.3NLTTFHH41 pKa = 6.45GTTAA45 pKa = 3.56
MM1 pKa = 7.32NRR3 pKa = 11.84LPWRR7 pKa = 11.84MGFLVSALISWTRR20 pKa = 11.84TPRR23 pKa = 11.84RR24 pKa = 11.84RR25 pKa = 11.84SASSSSLGHH34 pKa = 6.28EE35 pKa = 4.3NLTTFHH41 pKa = 6.45GTTAA45 pKa = 3.56
Molecular weight: 5.09 kDa
Isoelectric point according different methods:
Peptides (in silico digests for buttom-up proteomics)
Below you can find in silico digests of the whole proteome with Trypsin, Chymotrypsin, Trypsin+LysC, LysN, ArgC proteases suitable for different mass spec machines.| Try ESI |
 |
|---|
| ChTry ESI |
 |
|---|
| ArgC ESI |
 |
|---|
| LysN ESI |
 |
|---|
| TryLysC ESI |
 |
|---|
| Try MALDI |
 |
|---|
| ChTry MALDI |
 |
|---|
| ArgC MALDI |
 |
|---|
| LysN MALDI |
 |
|---|
| TryLysC MALDI |
 |
|---|
| Try LTQ |
 |
|---|
| ChTry LTQ |
 |
|---|
| ArgC LTQ |
 |
|---|
| LysN LTQ |
 |
|---|
| TryLysC LTQ |
 |
|---|
| Try MSlow |
 |
|---|
| ChTry MSlow |
 |
|---|
| ArgC MSlow |
 |
|---|
| LysN MSlow |
 |
|---|
| TryLysC MSlow |
 |
|---|
| Try MShigh |
 |
|---|
| ChTry MShigh |
 |
|---|
| ArgC MShigh |
 |
|---|
| LysN MShigh |
 |
|---|
| TryLysC MShigh |
 |
|---|
General Statistics
Number of major isoforms |
Number of additional isoforms |
Number of all proteins |
Number of amino acids |
Min. Seq. Length |
Max. Seq. Length |
Avg. Seq. Length |
Avg. Mol. Weight |
|---|---|---|---|---|---|---|---|
0 |
1332 |
45 |
724 |
222.0 |
24.82 |
Amino acid frequency
Ala |
Cys |
Asp |
Glu |
Phe |
Gly |
His |
Ile |
Lys |
Leu |
|---|---|---|---|---|---|---|---|---|---|
8.408 ± 1.31 | 1.652 ± 0.352 |
4.73 ± 0.794 | 5.03 ± 0.739 |
4.955 ± 0.631 | 6.682 ± 0.824 |
2.853 ± 0.651 | 5.405 ± 0.958 |
4.279 ± 0.48 | 7.883 ± 0.986 |
Met |
Asn |
Gln |
Pro |
Arg |
Ser |
Thr |
Val |
Trp |
Tyr |
|---|---|---|---|---|---|---|---|---|---|
2.928 ± 0.282 | 3.829 ± 0.575 |
5.105 ± 0.409 | 2.853 ± 0.677 |
7.733 ± 0.644 | 7.432 ± 1.143 |
5.631 ± 1.324 | 8.183 ± 0.642 |
1.201 ± 0.261 | 3.153 ± 0.29 |
Most of the basic statistics you can see at this page can be downloaded from this CSV file
Proteome-pI is available under Creative Commons Attribution-NoDerivs license, for more details see here
| Reference: Kozlowski LP. Proteome-pI 2.0: Proteome Isoelectric Point Database Update. Nucleic Acids Res. 2021, doi: 10.1093/nar/gkab944 | Contact: Lukasz P. Kozlowski |
