Holdemanella biformis DSM 3989
Taxonomy: cellular organisms; Bacteria; Terrabacteria group; Firmicutes; Erysipelotrichia; Erysipelotrichales; Erysipelotrichaceae; Holdemanella; Holdemanella biformis
Average proteome isoelectric point is 6.28
Get precalculated fractions of proteins

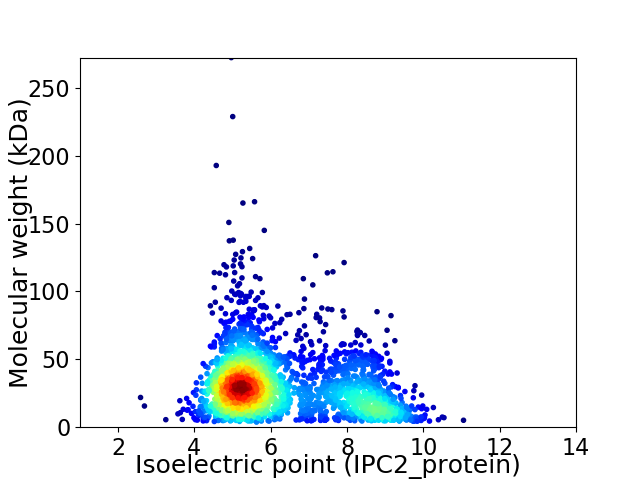
Virtual 2D-PAGE plot for 2528 proteins (isoelectric point calculated using IPC2_protein)
Get csv file with sequences according to given criteria:
* You can choose from 21 different methods for calculating isoelectric point
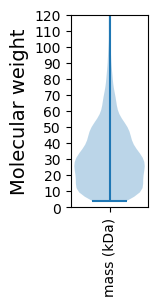
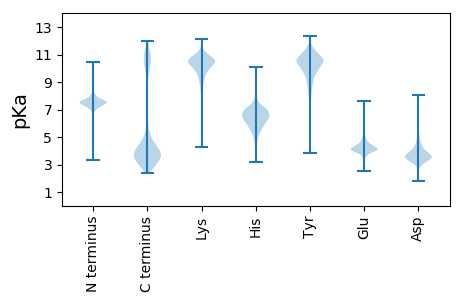
Summary statistics related to proteome-wise predictions


Protein with the lowest isoelectric point:
>tr|B7CBJ1|B7CBJ1_9FIRM Putative selenium-dependent hydroxylase accessory protein YqeC OS=Holdemanella biformis DSM 3989 OX=518637 GN=yqeC PE=4 SV=1
MM1 pKa = 7.28IKK3 pKa = 10.44VYY5 pKa = 10.52TEE7 pKa = 3.65VLGFNNLMYY16 pKa = 10.52RR17 pKa = 11.84YY18 pKa = 8.34MSLPNSLSLADD29 pKa = 3.73LAYY32 pKa = 9.05YY33 pKa = 9.42TLASYY38 pKa = 10.91LSEE41 pKa = 4.28EE42 pKa = 4.26YY43 pKa = 10.88ADD45 pKa = 5.63FVIEE49 pKa = 4.46SNGIPFACPNCEE61 pKa = 3.68DD62 pKa = 3.66EE63 pKa = 5.07QFNKK67 pKa = 10.23LPCASLIQPDD77 pKa = 4.47FKK79 pKa = 11.33EE80 pKa = 4.19GDD82 pKa = 3.88TFKK85 pKa = 10.44MVYY88 pKa = 10.1DD89 pKa = 3.89LEE91 pKa = 4.55EE92 pKa = 4.21PFEE95 pKa = 4.37IEE97 pKa = 3.82IQVEE101 pKa = 4.16KK102 pKa = 11.0VDD104 pKa = 4.96DD105 pKa = 3.92IEE107 pKa = 4.77EE108 pKa = 4.17EE109 pKa = 4.19SSVINGRR116 pKa = 11.84GFAIWDD122 pKa = 3.72GFKK125 pKa = 10.63EE126 pKa = 4.22FQDD129 pKa = 3.97YY130 pKa = 10.65YY131 pKa = 7.73YY132 pKa = 11.31QSMEE136 pKa = 4.01LFKK139 pKa = 10.83EE140 pKa = 4.16YY141 pKa = 11.06VKK143 pKa = 11.24ANDD146 pKa = 3.74MNLSDD151 pKa = 4.64FPVDD155 pKa = 3.41EE156 pKa = 5.19DD157 pKa = 4.97LDD159 pKa = 4.5IIEE162 pKa = 4.57LNKK165 pKa = 10.04VLEE168 pKa = 4.67DD169 pKa = 3.5NFEE172 pKa = 4.11EE173 pKa = 4.76LKK175 pKa = 10.88DD176 pKa = 3.87VYY178 pKa = 10.74EE179 pKa = 4.96GEE181 pKa = 4.23
MM1 pKa = 7.28IKK3 pKa = 10.44VYY5 pKa = 10.52TEE7 pKa = 3.65VLGFNNLMYY16 pKa = 10.52RR17 pKa = 11.84YY18 pKa = 8.34MSLPNSLSLADD29 pKa = 3.73LAYY32 pKa = 9.05YY33 pKa = 9.42TLASYY38 pKa = 10.91LSEE41 pKa = 4.28EE42 pKa = 4.26YY43 pKa = 10.88ADD45 pKa = 5.63FVIEE49 pKa = 4.46SNGIPFACPNCEE61 pKa = 3.68DD62 pKa = 3.66EE63 pKa = 5.07QFNKK67 pKa = 10.23LPCASLIQPDD77 pKa = 4.47FKK79 pKa = 11.33EE80 pKa = 4.19GDD82 pKa = 3.88TFKK85 pKa = 10.44MVYY88 pKa = 10.1DD89 pKa = 3.89LEE91 pKa = 4.55EE92 pKa = 4.21PFEE95 pKa = 4.37IEE97 pKa = 3.82IQVEE101 pKa = 4.16KK102 pKa = 11.0VDD104 pKa = 4.96DD105 pKa = 3.92IEE107 pKa = 4.77EE108 pKa = 4.17EE109 pKa = 4.19SSVINGRR116 pKa = 11.84GFAIWDD122 pKa = 3.72GFKK125 pKa = 10.63EE126 pKa = 4.22FQDD129 pKa = 3.97YY130 pKa = 10.65YY131 pKa = 7.73YY132 pKa = 11.31QSMEE136 pKa = 4.01LFKK139 pKa = 10.83EE140 pKa = 4.16YY141 pKa = 11.06VKK143 pKa = 11.24ANDD146 pKa = 3.74MNLSDD151 pKa = 4.64FPVDD155 pKa = 3.41EE156 pKa = 5.19DD157 pKa = 4.97LDD159 pKa = 4.5IIEE162 pKa = 4.57LNKK165 pKa = 10.04VLEE168 pKa = 4.67DD169 pKa = 3.5NFEE172 pKa = 4.11EE173 pKa = 4.76LKK175 pKa = 10.88DD176 pKa = 3.87VYY178 pKa = 10.74EE179 pKa = 4.96GEE181 pKa = 4.23
Molecular weight: 21.18 kDa
Isoelectric point according different methods:
Protein with the highest isoelectric point:
>tr|B7CCJ7|B7CCJ7_9FIRM Glycerol-3-phosphate cytidylyltransferase OS=Holdemanella biformis DSM 3989 OX=518637 GN=tagD PE=4 SV=1
MM1 pKa = 7.35KK2 pKa = 9.43RR3 pKa = 11.84TYY5 pKa = 10.14QPSKK9 pKa = 9.95RR10 pKa = 11.84KK11 pKa = 7.81HH12 pKa = 5.11QKK14 pKa = 8.48VHH16 pKa = 5.44GFRR19 pKa = 11.84ARR21 pKa = 11.84MATVGGRR28 pKa = 11.84NVLSRR33 pKa = 11.84RR34 pKa = 11.84RR35 pKa = 11.84AKK37 pKa = 9.99GRR39 pKa = 11.84KK40 pKa = 8.67VLSAA44 pKa = 4.05
MM1 pKa = 7.35KK2 pKa = 9.43RR3 pKa = 11.84TYY5 pKa = 10.14QPSKK9 pKa = 9.95RR10 pKa = 11.84KK11 pKa = 7.81HH12 pKa = 5.11QKK14 pKa = 8.48VHH16 pKa = 5.44GFRR19 pKa = 11.84ARR21 pKa = 11.84MATVGGRR28 pKa = 11.84NVLSRR33 pKa = 11.84RR34 pKa = 11.84RR35 pKa = 11.84AKK37 pKa = 9.99GRR39 pKa = 11.84KK40 pKa = 8.67VLSAA44 pKa = 4.05
Molecular weight: 5.11 kDa
Isoelectric point according different methods:
Peptides (in silico digests for buttom-up proteomics)
Below you can find in silico digests of the whole proteome with Trypsin, Chymotrypsin, Trypsin+LysC, LysN, ArgC proteases suitable for different mass spec machines.| Try ESI |
 |
|---|
| ChTry ESI |
 |
|---|
| ArgC ESI |
 |
|---|
| LysN ESI |
 |
|---|
| TryLysC ESI |
 |
|---|
| Try MALDI |
 |
|---|
| ChTry MALDI |
 |
|---|
| ArgC MALDI |
 |
|---|
| LysN MALDI |
 |
|---|
| TryLysC MALDI |
 |
|---|
| Try LTQ |
 |
|---|
| ChTry LTQ |
 |
|---|
| ArgC LTQ |
 |
|---|
| LysN LTQ |
 |
|---|
| TryLysC LTQ |
 |
|---|
| Try MSlow |
 |
|---|
| ChTry MSlow |
 |
|---|
| ArgC MSlow |
 |
|---|
| LysN MSlow |
 |
|---|
| TryLysC MSlow |
 |
|---|
| Try MShigh |
 |
|---|
| ChTry MShigh |
 |
|---|
| ArgC MShigh |
 |
|---|
| LysN MShigh |
 |
|---|
| TryLysC MShigh |
 |
|---|
General Statistics
Number of major isoforms |
Number of additional isoforms |
Number of all proteins |
Number of amino acids |
Min. Seq. Length |
Max. Seq. Length |
Avg. Seq. Length |
Avg. Mol. Weight |
|---|---|---|---|---|---|---|---|
0 |
730521 |
33 |
2587 |
289.0 |
32.82 |
Amino acid frequency
Ala |
Cys |
Asp |
Glu |
Phe |
Gly |
His |
Ile |
Lys |
Leu |
|---|---|---|---|---|---|---|---|---|---|
5.922 ± 0.055 | 1.657 ± 0.022 |
6.044 ± 0.042 | 6.969 ± 0.045 |
4.477 ± 0.041 | 5.885 ± 0.052 |
2.013 ± 0.023 | 7.941 ± 0.053 |
8.054 ± 0.046 | 9.151 ± 0.051 |
Met |
Asn |
Gln |
Pro |
Arg |
Ser |
Thr |
Val |
Trp |
Tyr |
|---|---|---|---|---|---|---|---|---|---|
3.17 ± 0.026 | 5.378 ± 0.042 |
2.848 ± 0.023 | 3.496 ± 0.03 |
3.49 ± 0.034 | 6.168 ± 0.039 |
5.169 ± 0.039 | 6.814 ± 0.043 |
0.817 ± 0.016 | 4.537 ± 0.037 |
Most of the basic statistics you can see at this page can be downloaded from this CSV file
Proteome-pI is available under Creative Commons Attribution-NoDerivs license, for more details see here
| Reference: Kozlowski LP. Proteome-pI 2.0: Proteome Isoelectric Point Database Update. Nucleic Acids Res. 2021, doi: 10.1093/nar/gkab944 | Contact: Lukasz P. Kozlowski |
