Mycobacterium phage Frankie
Taxonomy: Viruses; Duplodnaviria; Heunggongvirae; Uroviricota; Caudoviricetes; Caudovirales; Siphoviridae; Cheoctovirus; unclassified Cheoctovirus
Average proteome isoelectric point is 6.0
Get precalculated fractions of proteins

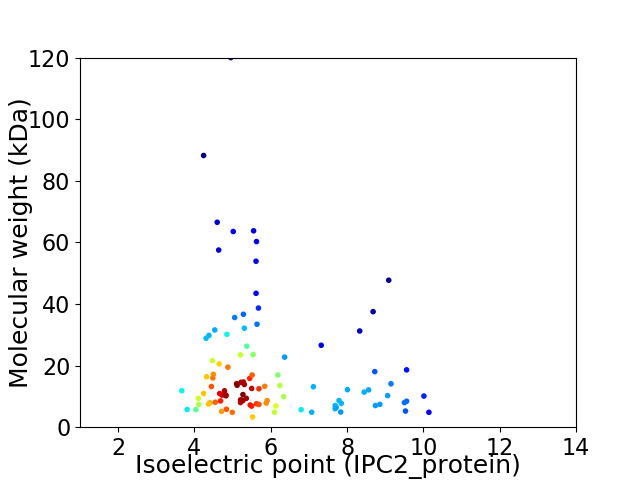
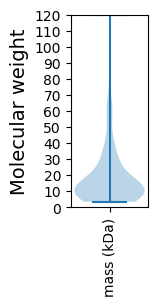
Virtual 2D-PAGE plot for 103 proteins (isoelectric point calculated using IPC2_protein)
Get csv file with sequences according to given criteria:
* You can choose from 21 different methods for calculating isoelectric point
Summary statistics related to proteome-wise predictions


Protein with the lowest isoelectric point:
>tr|A0A2L0HJY7|A0A2L0HJY7_9CAUD Uncharacterized protein OS=Mycobacterium phage Frankie OX=2079565 GN=SEA_FRANKIE_89 PE=4 SV=1
MM1 pKa = 8.28PDD3 pKa = 4.48PINYY7 pKa = 10.02DD8 pKa = 3.46EE9 pKa = 5.03TPCALCDD16 pKa = 4.32CYY18 pKa = 11.21GLQHH22 pKa = 7.56DD23 pKa = 4.88DD24 pKa = 4.18PEE26 pKa = 6.27HH27 pKa = 6.52GGPCRR32 pKa = 11.84ALDD35 pKa = 3.54GHH37 pKa = 6.34GRR39 pKa = 11.84PCGCPGFEE47 pKa = 4.28EE48 pKa = 5.39PEE50 pKa = 4.24DD51 pKa = 3.69ATT53 pKa = 4.48
MM1 pKa = 8.28PDD3 pKa = 4.48PINYY7 pKa = 10.02DD8 pKa = 3.46EE9 pKa = 5.03TPCALCDD16 pKa = 4.32CYY18 pKa = 11.21GLQHH22 pKa = 7.56DD23 pKa = 4.88DD24 pKa = 4.18PEE26 pKa = 6.27HH27 pKa = 6.52GGPCRR32 pKa = 11.84ALDD35 pKa = 3.54GHH37 pKa = 6.34GRR39 pKa = 11.84PCGCPGFEE47 pKa = 4.28EE48 pKa = 5.39PEE50 pKa = 4.24DD51 pKa = 3.69ATT53 pKa = 4.48
Molecular weight: 5.7 kDa
Isoelectric point according different methods:
Protein with the highest isoelectric point:
>tr|A0A2L0HJU3|A0A2L0HJU3_9CAUD Integrase OS=Mycobacterium phage Frankie OX=2079565 GN=SEA_FRANKIE_47 PE=3 SV=1
MM1 pKa = 6.98TEE3 pKa = 3.01VWRR6 pKa = 11.84PVVGQEE12 pKa = 4.07GNYY15 pKa = 9.54EE16 pKa = 3.98VSNLGRR22 pKa = 11.84VRR24 pKa = 11.84SLDD27 pKa = 3.39RR28 pKa = 11.84QIDD31 pKa = 3.28VDD33 pKa = 3.8GRR35 pKa = 11.84GRR37 pKa = 11.84RR38 pKa = 11.84YY39 pKa = 8.99MRR41 pKa = 11.84GRR43 pKa = 11.84VLSLVPMKK51 pKa = 10.7NGYY54 pKa = 9.18RR55 pKa = 11.84LAALPGGKK63 pKa = 9.54KK64 pKa = 9.54LVHH67 pKa = 6.24RR68 pKa = 11.84LVLEE72 pKa = 4.44AFSGPCPPGAEE83 pKa = 4.38GCHH86 pKa = 6.06NDD88 pKa = 3.71GDD90 pKa = 4.04RR91 pKa = 11.84SNNRR95 pKa = 11.84IEE97 pKa = 4.0NLRR100 pKa = 11.84WDD102 pKa = 3.48TRR104 pKa = 11.84TANNIDD110 pKa = 3.79AVDD113 pKa = 4.53HH114 pKa = 5.46RR115 pKa = 11.84TNWQSRR121 pKa = 11.84KK122 pKa = 8.02DD123 pKa = 3.56TCPRR127 pKa = 11.84GHH129 pKa = 6.53VYY131 pKa = 10.8DD132 pKa = 4.42GVSHH136 pKa = 7.04RR137 pKa = 11.84SNGRR141 pKa = 11.84PMRR144 pKa = 11.84YY145 pKa = 9.68CKK147 pKa = 9.69TCRR150 pKa = 11.84NARR153 pKa = 11.84NRR155 pKa = 11.84EE156 pKa = 3.47AWRR159 pKa = 11.84RR160 pKa = 11.84SHH162 pKa = 6.89
MM1 pKa = 6.98TEE3 pKa = 3.01VWRR6 pKa = 11.84PVVGQEE12 pKa = 4.07GNYY15 pKa = 9.54EE16 pKa = 3.98VSNLGRR22 pKa = 11.84VRR24 pKa = 11.84SLDD27 pKa = 3.39RR28 pKa = 11.84QIDD31 pKa = 3.28VDD33 pKa = 3.8GRR35 pKa = 11.84GRR37 pKa = 11.84RR38 pKa = 11.84YY39 pKa = 8.99MRR41 pKa = 11.84GRR43 pKa = 11.84VLSLVPMKK51 pKa = 10.7NGYY54 pKa = 9.18RR55 pKa = 11.84LAALPGGKK63 pKa = 9.54KK64 pKa = 9.54LVHH67 pKa = 6.24RR68 pKa = 11.84LVLEE72 pKa = 4.44AFSGPCPPGAEE83 pKa = 4.38GCHH86 pKa = 6.06NDD88 pKa = 3.71GDD90 pKa = 4.04RR91 pKa = 11.84SNNRR95 pKa = 11.84IEE97 pKa = 4.0NLRR100 pKa = 11.84WDD102 pKa = 3.48TRR104 pKa = 11.84TANNIDD110 pKa = 3.79AVDD113 pKa = 4.53HH114 pKa = 5.46RR115 pKa = 11.84TNWQSRR121 pKa = 11.84KK122 pKa = 8.02DD123 pKa = 3.56TCPRR127 pKa = 11.84GHH129 pKa = 6.53VYY131 pKa = 10.8DD132 pKa = 4.42GVSHH136 pKa = 7.04RR137 pKa = 11.84SNGRR141 pKa = 11.84PMRR144 pKa = 11.84YY145 pKa = 9.68CKK147 pKa = 9.69TCRR150 pKa = 11.84NARR153 pKa = 11.84NRR155 pKa = 11.84EE156 pKa = 3.47AWRR159 pKa = 11.84RR160 pKa = 11.84SHH162 pKa = 6.89
Molecular weight: 18.62 kDa
Isoelectric point according different methods:
Peptides (in silico digests for buttom-up proteomics)
Below you can find in silico digests of the whole proteome with Trypsin, Chymotrypsin, Trypsin+LysC, LysN, ArgC proteases suitable for different mass spec machines.| Try ESI |
 |
|---|
| ChTry ESI |
 |
|---|
| ArgC ESI |
 |
|---|
| LysN ESI |
 |
|---|
| TryLysC ESI |
 |
|---|
| Try MALDI |
 |
|---|
| ChTry MALDI |
 |
|---|
| ArgC MALDI |
 |
|---|
| LysN MALDI |
 |
|---|
| TryLysC MALDI |
 |
|---|
| Try LTQ |
 |
|---|
| ChTry LTQ |
 |
|---|
| ArgC LTQ |
 |
|---|
| LysN LTQ |
 |
|---|
| TryLysC LTQ |
 |
|---|
| Try MSlow |
 |
|---|
| ChTry MSlow |
 |
|---|
| ArgC MSlow |
 |
|---|
| LysN MSlow |
 |
|---|
| TryLysC MSlow |
 |
|---|
| Try MShigh |
 |
|---|
| ChTry MShigh |
 |
|---|
| ArgC MShigh |
 |
|---|
| LysN MShigh |
 |
|---|
| TryLysC MShigh |
 |
|---|
General Statistics
Number of major isoforms |
Number of additional isoforms |
Number of all proteins |
Number of amino acids |
Min. Seq. Length |
Max. Seq. Length |
Avg. Seq. Length |
Avg. Mol. Weight |
|---|---|---|---|---|---|---|---|
0 |
17959 |
30 |
1191 |
174.4 |
18.98 |
Amino acid frequency
Ala |
Cys |
Asp |
Glu |
Phe |
Gly |
His |
Ile |
Lys |
Leu |
|---|---|---|---|---|---|---|---|---|---|
11.387 ± 0.444 | 1.158 ± 0.15 |
6.726 ± 0.232 | 5.663 ± 0.275 |
2.801 ± 0.177 | 8.586 ± 0.507 |
2.183 ± 0.172 | 4.46 ± 0.183 |
3.285 ± 0.182 | 7.456 ± 0.193 |
Met |
Asn |
Gln |
Pro |
Arg |
Ser |
Thr |
Val |
Trp |
Tyr |
|---|---|---|---|---|---|---|---|---|---|
2.244 ± 0.114 | 3.308 ± 0.199 |
6.097 ± 0.203 | 3.447 ± 0.182 |
6.699 ± 0.381 | 5.997 ± 0.275 |
6.298 ± 0.261 | 7.484 ± 0.316 |
2.105 ± 0.145 | 2.617 ± 0.156 |
Most of the basic statistics you can see at this page can be downloaded from this CSV file
Proteome-pI is available under Creative Commons Attribution-NoDerivs license, for more details see here
| Reference: Kozlowski LP. Proteome-pI 2.0: Proteome Isoelectric Point Database Update. Nucleic Acids Res. 2021, doi: 10.1093/nar/gkab944 | Contact: Lukasz P. Kozlowski |
