Rhizobiales bacterium IZ6
Taxonomy: cellular organisms; Bacteria; Proteobacteria; Alphaproteobacteria; Hyphomicrobiales; unclassified Hyphomicrobiales
Average proteome isoelectric point is 6.62
Get precalculated fractions of proteins

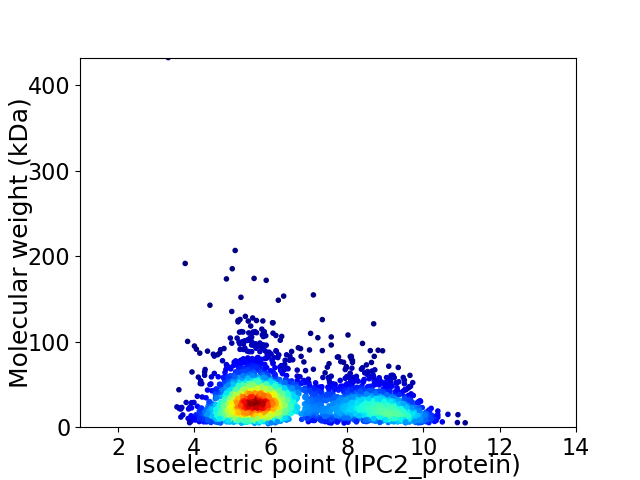
Virtual 2D-PAGE plot for 3159 proteins (isoelectric point calculated using IPC2_protein)
Get csv file with sequences according to given criteria:
* You can choose from 21 different methods for calculating isoelectric point
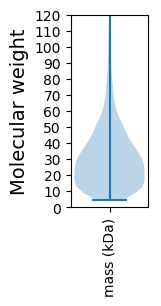
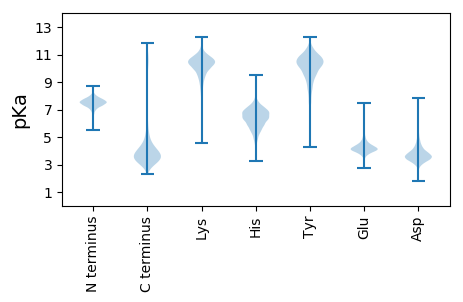
Summary statistics related to proteome-wise predictions


Protein with the lowest isoelectric point:
>tr|A0A6S6QTZ3|A0A6S6QTZ3_9RHIZ Hemolysin secretion protein D OS=Rhizobiales bacterium IZ6 OX=708113 GN=IZ6_11550 PE=3 SV=1
MM1 pKa = 7.51KK2 pKa = 10.42RR3 pKa = 11.84ILLAGAALAVMTTAPMAADD22 pKa = 3.55YY23 pKa = 9.17AAPADD28 pKa = 3.61VDD30 pKa = 3.49VWSGYY35 pKa = 9.73FVGIQGGYY43 pKa = 9.47AFKK46 pKa = 10.79DD47 pKa = 3.36VEE49 pKa = 4.44TLVDD53 pKa = 3.69GADD56 pKa = 4.27DD57 pKa = 5.03DD58 pKa = 5.24FEE60 pKa = 7.27SDD62 pKa = 3.87DD63 pKa = 4.07FVIGAYY69 pKa = 9.85YY70 pKa = 9.46GRR72 pKa = 11.84NWQSGDD78 pKa = 2.94WVFGLDD84 pKa = 4.44SSISYY89 pKa = 10.18IGLDD93 pKa = 3.33EE94 pKa = 5.86DD95 pKa = 4.75EE96 pKa = 4.55IAGNVNLEE104 pKa = 4.22LEE106 pKa = 4.49ANLLGLSRR114 pKa = 11.84LKK116 pKa = 10.8VGYY119 pKa = 10.34AVDD122 pKa = 3.41NTLFFVAGGVASTYY136 pKa = 10.37FSAEE140 pKa = 3.88DD141 pKa = 3.58TATDD145 pKa = 5.11DD146 pKa = 5.67DD147 pKa = 5.81DD148 pKa = 7.22DD149 pKa = 5.81DD150 pKa = 4.2FALGFTVGAGVEE162 pKa = 4.51HH163 pKa = 7.08KK164 pKa = 10.84FSDD167 pKa = 3.33SWSARR172 pKa = 11.84IEE174 pKa = 3.77YY175 pKa = 10.0AYY177 pKa = 10.83FNIEE181 pKa = 4.01SDD183 pKa = 4.02DD184 pKa = 3.72MTVNADD190 pKa = 3.94DD191 pKa = 4.63IEE193 pKa = 5.18LEE195 pKa = 4.34VEE197 pKa = 3.91GHH199 pKa = 5.25IVRR202 pKa = 11.84GGIAYY207 pKa = 9.53HH208 pKa = 6.3FF209 pKa = 4.53
MM1 pKa = 7.51KK2 pKa = 10.42RR3 pKa = 11.84ILLAGAALAVMTTAPMAADD22 pKa = 3.55YY23 pKa = 9.17AAPADD28 pKa = 3.61VDD30 pKa = 3.49VWSGYY35 pKa = 9.73FVGIQGGYY43 pKa = 9.47AFKK46 pKa = 10.79DD47 pKa = 3.36VEE49 pKa = 4.44TLVDD53 pKa = 3.69GADD56 pKa = 4.27DD57 pKa = 5.03DD58 pKa = 5.24FEE60 pKa = 7.27SDD62 pKa = 3.87DD63 pKa = 4.07FVIGAYY69 pKa = 9.85YY70 pKa = 9.46GRR72 pKa = 11.84NWQSGDD78 pKa = 2.94WVFGLDD84 pKa = 4.44SSISYY89 pKa = 10.18IGLDD93 pKa = 3.33EE94 pKa = 5.86DD95 pKa = 4.75EE96 pKa = 4.55IAGNVNLEE104 pKa = 4.22LEE106 pKa = 4.49ANLLGLSRR114 pKa = 11.84LKK116 pKa = 10.8VGYY119 pKa = 10.34AVDD122 pKa = 3.41NTLFFVAGGVASTYY136 pKa = 10.37FSAEE140 pKa = 3.88DD141 pKa = 3.58TATDD145 pKa = 5.11DD146 pKa = 5.67DD147 pKa = 5.81DD148 pKa = 7.22DD149 pKa = 5.81DD150 pKa = 4.2FALGFTVGAGVEE162 pKa = 4.51HH163 pKa = 7.08KK164 pKa = 10.84FSDD167 pKa = 3.33SWSARR172 pKa = 11.84IEE174 pKa = 3.77YY175 pKa = 10.0AYY177 pKa = 10.83FNIEE181 pKa = 4.01SDD183 pKa = 4.02DD184 pKa = 3.72MTVNADD190 pKa = 3.94DD191 pKa = 4.63IEE193 pKa = 5.18LEE195 pKa = 4.34VEE197 pKa = 3.91GHH199 pKa = 5.25IVRR202 pKa = 11.84GGIAYY207 pKa = 9.53HH208 pKa = 6.3FF209 pKa = 4.53
Molecular weight: 22.61 kDa
Isoelectric point according different methods:
Protein with the highest isoelectric point:
>tr|A0A6S6QWV0|A0A6S6QWV0_9RHIZ Glyoxalase OS=Rhizobiales bacterium IZ6 OX=708113 GN=IZ6_17430 PE=4 SV=1
MM1 pKa = 7.35KK2 pKa = 9.43RR3 pKa = 11.84TYY5 pKa = 10.27QPSKK9 pKa = 9.73LVRR12 pKa = 11.84KK13 pKa = 9.15RR14 pKa = 11.84RR15 pKa = 11.84HH16 pKa = 4.42GFRR19 pKa = 11.84ARR21 pKa = 11.84MATAGGRR28 pKa = 11.84KK29 pKa = 9.01VLANRR34 pKa = 11.84RR35 pKa = 11.84KK36 pKa = 9.81HH37 pKa = 5.14GRR39 pKa = 11.84KK40 pKa = 9.35KK41 pKa = 10.68LSAA44 pKa = 3.99
MM1 pKa = 7.35KK2 pKa = 9.43RR3 pKa = 11.84TYY5 pKa = 10.27QPSKK9 pKa = 9.73LVRR12 pKa = 11.84KK13 pKa = 9.15RR14 pKa = 11.84RR15 pKa = 11.84HH16 pKa = 4.42GFRR19 pKa = 11.84ARR21 pKa = 11.84MATAGGRR28 pKa = 11.84KK29 pKa = 9.01VLANRR34 pKa = 11.84RR35 pKa = 11.84KK36 pKa = 9.81HH37 pKa = 5.14GRR39 pKa = 11.84KK40 pKa = 9.35KK41 pKa = 10.68LSAA44 pKa = 3.99
Molecular weight: 5.16 kDa
Isoelectric point according different methods:
Peptides (in silico digests for buttom-up proteomics)
Below you can find in silico digests of the whole proteome with Trypsin, Chymotrypsin, Trypsin+LysC, LysN, ArgC proteases suitable for different mass spec machines.| Try ESI |
 |
|---|
| ChTry ESI |
 |
|---|
| ArgC ESI |
 |
|---|
| LysN ESI |
 |
|---|
| TryLysC ESI |
 |
|---|
| Try MALDI |
 |
|---|
| ChTry MALDI |
 |
|---|
| ArgC MALDI |
 |
|---|
| LysN MALDI |
 |
|---|
| TryLysC MALDI |
 |
|---|
| Try LTQ |
 |
|---|
| ChTry LTQ |
 |
|---|
| ArgC LTQ |
 |
|---|
| LysN LTQ |
 |
|---|
| TryLysC LTQ |
 |
|---|
| Try MSlow |
 |
|---|
| ChTry MSlow |
 |
|---|
| ArgC MSlow |
 |
|---|
| LysN MSlow |
 |
|---|
| TryLysC MSlow |
 |
|---|
| Try MShigh |
 |
|---|
| ChTry MShigh |
 |
|---|
| ArgC MShigh |
 |
|---|
| LysN MShigh |
 |
|---|
| TryLysC MShigh |
 |
|---|
General Statistics
Number of major isoforms |
Number of additional isoforms |
Number of all proteins |
Number of amino acids |
Min. Seq. Length |
Max. Seq. Length |
Avg. Seq. Length |
Avg. Mol. Weight |
|---|---|---|---|---|---|---|---|
0 |
948505 |
40 |
4227 |
300.3 |
32.58 |
Amino acid frequency
Ala |
Cys |
Asp |
Glu |
Phe |
Gly |
His |
Ile |
Lys |
Leu |
|---|---|---|---|---|---|---|---|---|---|
12.206 ± 0.06 | 0.722 ± 0.014 |
5.703 ± 0.046 | 6.009 ± 0.042 |
3.913 ± 0.031 | 8.56 ± 0.045 |
1.907 ± 0.022 | 5.429 ± 0.034 |
4.188 ± 0.046 | 9.983 ± 0.049 |
Met |
Asn |
Gln |
Pro |
Arg |
Ser |
Thr |
Val |
Trp |
Tyr |
|---|---|---|---|---|---|---|---|---|---|
2.296 ± 0.021 | 2.673 ± 0.03 |
5.217 ± 0.035 | 2.905 ± 0.021 |
6.691 ± 0.052 | 5.473 ± 0.033 |
5.301 ± 0.034 | 7.415 ± 0.035 |
1.228 ± 0.018 | 2.181 ± 0.023 |
Most of the basic statistics you can see at this page can be downloaded from this CSV file
Proteome-pI is available under Creative Commons Attribution-NoDerivs license, for more details see here
| Reference: Kozlowski LP. Proteome-pI 2.0: Proteome Isoelectric Point Database Update. Nucleic Acids Res. 2021, doi: 10.1093/nar/gkab944 | Contact: Lukasz P. Kozlowski |
