Gordonia phage Horus
Taxonomy: Viruses; Duplodnaviria; Heunggongvirae; Uroviricota; Caudoviricetes; Caudovirales; Siphoviridae; Langleyhallvirinae; Horusvirus; Gordonia virus Horus
Average proteome isoelectric point is 6.26
Get precalculated fractions of proteins

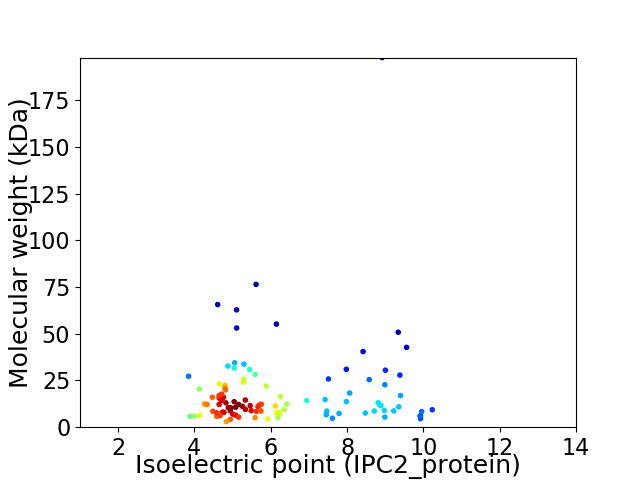
Virtual 2D-PAGE plot for 103 proteins (isoelectric point calculated using IPC2_protein)
Get csv file with sequences according to given criteria:
* You can choose from 21 different methods for calculating isoelectric point
Summary statistics related to proteome-wise predictions


Protein with the lowest isoelectric point:
>tr|A0A385DWH9|A0A385DWH9_9CAUD Membrane protein OS=Gordonia phage Horus OX=2301696 GN=27 PE=4 SV=1
MM1 pKa = 7.2MNRR4 pKa = 11.84RR5 pKa = 11.84LAIAAVCAAAACILSSCSSDD25 pKa = 3.9SGDD28 pKa = 3.21TAAASSSSMAPSTVEE43 pKa = 3.81TNGRR47 pKa = 11.84GAIEE51 pKa = 4.15VALGEE56 pKa = 4.22PVAITGSDD64 pKa = 3.7GAPVLTITGTRR75 pKa = 11.84LDD77 pKa = 3.8STGCAGDD84 pKa = 3.79HH85 pKa = 7.05PEE87 pKa = 3.94VAHH90 pKa = 5.96TKK92 pKa = 10.09FVATIQTGDD101 pKa = 3.42VEE103 pKa = 4.67TEE105 pKa = 3.5QWLWPSDD112 pKa = 3.5FYY114 pKa = 11.89YY115 pKa = 11.37VNDD118 pKa = 4.05ANKK121 pKa = 9.42VAQNSEE127 pKa = 4.02IEE129 pKa = 4.3QATDD133 pKa = 2.9TAFACEE139 pKa = 4.18GSVEE143 pKa = 4.82FIDD146 pKa = 4.98VPPNTSKK153 pKa = 11.11DD154 pKa = 3.52GSPTLSVPVMTTAIGYY170 pKa = 9.22HH171 pKa = 7.11LDD173 pKa = 3.51TAGVDD178 pKa = 4.07QRR180 pKa = 11.84VEE182 pKa = 3.79WKK184 pKa = 10.76LPAEE188 pKa = 4.22WRR190 pKa = 11.84QALAPVTSEE199 pKa = 4.27APATTTEE206 pKa = 4.15QPAPEE211 pKa = 4.28PTNPAPEE218 pKa = 4.12TTAPDD223 pKa = 3.35TAAPDD228 pKa = 3.44SGGIPPGWDD237 pKa = 2.97KK238 pKa = 11.77NGDD241 pKa = 3.45GMIDD245 pKa = 3.22TDD247 pKa = 4.84APIGDD252 pKa = 4.12DD253 pKa = 4.88CEE255 pKa = 4.46TPEE258 pKa = 4.42CLMGEE263 pKa = 4.58GGG265 pKa = 3.8
MM1 pKa = 7.2MNRR4 pKa = 11.84RR5 pKa = 11.84LAIAAVCAAAACILSSCSSDD25 pKa = 3.9SGDD28 pKa = 3.21TAAASSSSMAPSTVEE43 pKa = 3.81TNGRR47 pKa = 11.84GAIEE51 pKa = 4.15VALGEE56 pKa = 4.22PVAITGSDD64 pKa = 3.7GAPVLTITGTRR75 pKa = 11.84LDD77 pKa = 3.8STGCAGDD84 pKa = 3.79HH85 pKa = 7.05PEE87 pKa = 3.94VAHH90 pKa = 5.96TKK92 pKa = 10.09FVATIQTGDD101 pKa = 3.42VEE103 pKa = 4.67TEE105 pKa = 3.5QWLWPSDD112 pKa = 3.5FYY114 pKa = 11.89YY115 pKa = 11.37VNDD118 pKa = 4.05ANKK121 pKa = 9.42VAQNSEE127 pKa = 4.02IEE129 pKa = 4.3QATDD133 pKa = 2.9TAFACEE139 pKa = 4.18GSVEE143 pKa = 4.82FIDD146 pKa = 4.98VPPNTSKK153 pKa = 11.11DD154 pKa = 3.52GSPTLSVPVMTTAIGYY170 pKa = 9.22HH171 pKa = 7.11LDD173 pKa = 3.51TAGVDD178 pKa = 4.07QRR180 pKa = 11.84VEE182 pKa = 3.79WKK184 pKa = 10.76LPAEE188 pKa = 4.22WRR190 pKa = 11.84QALAPVTSEE199 pKa = 4.27APATTTEE206 pKa = 4.15QPAPEE211 pKa = 4.28PTNPAPEE218 pKa = 4.12TTAPDD223 pKa = 3.35TAAPDD228 pKa = 3.44SGGIPPGWDD237 pKa = 2.97KK238 pKa = 11.77NGDD241 pKa = 3.45GMIDD245 pKa = 3.22TDD247 pKa = 4.84APIGDD252 pKa = 4.12DD253 pKa = 4.88CEE255 pKa = 4.46TPEE258 pKa = 4.42CLMGEE263 pKa = 4.58GGG265 pKa = 3.8
Molecular weight: 27.27 kDa
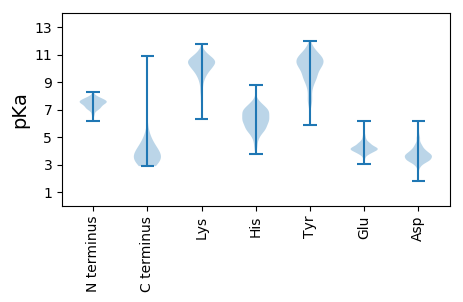
Isoelectric point according different methods:
Protein with the highest isoelectric point:
>tr|A0A385DZ79|A0A385DZ79_9CAUD WhiB family transcription factor OS=Gordonia phage Horus OX=2301696 GN=70 PE=3 SV=1
MM1 pKa = 7.24IGKK4 pKa = 8.92PIRR7 pKa = 11.84EE8 pKa = 4.13LVATEE13 pKa = 4.62DD14 pKa = 3.66DD15 pKa = 3.88PLYY18 pKa = 10.68GLSARR23 pKa = 11.84YY24 pKa = 9.22VRR26 pKa = 11.84RR27 pKa = 11.84HH28 pKa = 5.75LEE30 pKa = 3.78AGGLFRR36 pKa = 11.84GLGSQRR42 pKa = 11.84CKK44 pKa = 10.29RR45 pKa = 11.84GEE47 pKa = 3.73WLLNRR52 pKa = 11.84EE53 pKa = 4.45DD54 pKa = 3.27VAEE57 pKa = 3.93IQRR60 pKa = 11.84RR61 pKa = 11.84LRR63 pKa = 11.84AVPDD67 pKa = 3.6QEE69 pKa = 4.38PVEE72 pKa = 4.59LDD74 pKa = 3.6TPSGLSSRR82 pKa = 11.84SRR84 pKa = 11.84TLRR87 pKa = 11.84RR88 pKa = 11.84IQQGRR93 pKa = 11.84ASSS96 pKa = 3.28
MM1 pKa = 7.24IGKK4 pKa = 8.92PIRR7 pKa = 11.84EE8 pKa = 4.13LVATEE13 pKa = 4.62DD14 pKa = 3.66DD15 pKa = 3.88PLYY18 pKa = 10.68GLSARR23 pKa = 11.84YY24 pKa = 9.22VRR26 pKa = 11.84RR27 pKa = 11.84HH28 pKa = 5.75LEE30 pKa = 3.78AGGLFRR36 pKa = 11.84GLGSQRR42 pKa = 11.84CKK44 pKa = 10.29RR45 pKa = 11.84GEE47 pKa = 3.73WLLNRR52 pKa = 11.84EE53 pKa = 4.45DD54 pKa = 3.27VAEE57 pKa = 3.93IQRR60 pKa = 11.84RR61 pKa = 11.84LRR63 pKa = 11.84AVPDD67 pKa = 3.6QEE69 pKa = 4.38PVEE72 pKa = 4.59LDD74 pKa = 3.6TPSGLSSRR82 pKa = 11.84SRR84 pKa = 11.84TLRR87 pKa = 11.84RR88 pKa = 11.84IQQGRR93 pKa = 11.84ASSS96 pKa = 3.28
Molecular weight: 10.9 kDa
Isoelectric point according different methods:
Peptides (in silico digests for buttom-up proteomics)
Below you can find in silico digests of the whole proteome with Trypsin, Chymotrypsin, Trypsin+LysC, LysN, ArgC proteases suitable for different mass spec machines.| Try ESI |
 |
|---|
| ChTry ESI |
 |
|---|
| ArgC ESI |
 |
|---|
| LysN ESI |
 |
|---|
| TryLysC ESI |
 |
|---|
| Try MALDI |
 |
|---|
| ChTry MALDI |
 |
|---|
| ArgC MALDI |
 |
|---|
| LysN MALDI |
 |
|---|
| TryLysC MALDI |
 |
|---|
| Try LTQ |
 |
|---|
| ChTry LTQ |
 |
|---|
| ArgC LTQ |
 |
|---|
| LysN LTQ |
 |
|---|
| TryLysC LTQ |
 |
|---|
| Try MSlow |
 |
|---|
| ChTry MSlow |
 |
|---|
| ArgC MSlow |
 |
|---|
| LysN MSlow |
 |
|---|
| TryLysC MSlow |
 |
|---|
| Try MShigh |
 |
|---|
| ChTry MShigh |
 |
|---|
| ArgC MShigh |
 |
|---|
| LysN MShigh |
 |
|---|
| TryLysC MShigh |
 |
|---|
General Statistics
Number of major isoforms |
Number of additional isoforms |
Number of all proteins |
Number of amino acids |
Min. Seq. Length |
Max. Seq. Length |
Avg. Seq. Length |
Avg. Mol. Weight |
|---|---|---|---|---|---|---|---|
0 |
17642 |
28 |
1862 |
171.3 |
18.73 |
Amino acid frequency
Ala |
Cys |
Asp |
Glu |
Phe |
Gly |
His |
Ile |
Lys |
Leu |
|---|---|---|---|---|---|---|---|---|---|
11.24 ± 0.425 | 1.196 ± 0.194 |
6.502 ± 0.303 | 5.617 ± 0.29 |
2.726 ± 0.219 | 8.446 ± 0.35 |
2.211 ± 0.168 | 4.654 ± 0.187 |
3.656 ± 0.275 | 7.777 ± 0.288 |
Met |
Asn |
Gln |
Pro |
Arg |
Ser |
Thr |
Val |
Trp |
Tyr |
|---|---|---|---|---|---|---|---|---|---|
2.369 ± 0.176 | 2.766 ± 0.188 |
5.391 ± 0.195 | 3.514 ± 0.157 |
7.176 ± 0.336 | 5.901 ± 0.266 |
6.485 ± 0.308 | 7.737 ± 0.356 |
2.205 ± 0.131 | 2.432 ± 0.194 |
Most of the basic statistics you can see at this page can be downloaded from this CSV file
Proteome-pI is available under Creative Commons Attribution-NoDerivs license, for more details see here
| Reference: Kozlowski LP. Proteome-pI 2.0: Proteome Isoelectric Point Database Update. Nucleic Acids Res. 2021, doi: 10.1093/nar/gkab944 | Contact: Lukasz P. Kozlowski |
