Opisthorchis viverrini
Taxonomy: cellular organisms; Eukaryota; Opisthokonta; Metazoa; Eumetazoa; Bilateria; Protostomia; Spiralia; Lophotrochozoa; Platyhelminthes; Trematoda; Digenea; Opisthorchiida; Opisthorchiata; Opisthorchiidae; Opisthorchis
Average proteome isoelectric point is 7.16
Get precalculated fractions of proteins

Virtual 2D-PAGE plot for 16307 proteins (isoelectric point calculated using IPC2_protein)
Get csv file with sequences according to given criteria:
* You can choose from 21 different methods for calculating isoelectric point
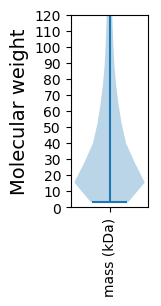
Summary statistics related to proteome-wise predictions


Protein with the lowest isoelectric point:
>tr|A0A075A5H0|A0A075A5H0_9TREM Uncharacterized protein OS=Opisthorchis viverrini OX=6198 GN=T265_02786 PE=4 SV=1
MM1 pKa = 7.07VAVCGVSPSMVVRR14 pKa = 11.84QPNVSLFEE22 pKa = 4.23GSQNLDD28 pKa = 2.98VGTVVIDD35 pKa = 3.62EE36 pKa = 4.85RR37 pKa = 11.84CFTWEE42 pKa = 3.78GQSRR46 pKa = 11.84QFSVPYY52 pKa = 9.78QQITLHH58 pKa = 6.88AISKK62 pKa = 9.42DD63 pKa = 3.34PVMAAGDD70 pKa = 3.67QPAPEE75 pKa = 4.04NTFPHH80 pKa = 6.17PHH82 pKa = 6.74LLVMIDD88 pKa = 3.25GDD90 pKa = 3.99RR91 pKa = 11.84PYY93 pKa = 11.17SPPHH97 pKa = 6.5PNGQIAGEE105 pKa = 3.97PMAIDD110 pKa = 3.98GAEE113 pKa = 4.06HH114 pKa = 7.22SDD116 pKa = 3.21TDD118 pKa = 3.96GSNEE122 pKa = 4.08SQEE125 pKa = 4.67DD126 pKa = 3.51ATSQGRR132 pKa = 11.84ASDD135 pKa = 4.22CPGEE139 pKa = 4.2TTILRR144 pKa = 11.84FVPQDD149 pKa = 3.54PNALDD154 pKa = 3.26TMYY157 pKa = 11.18AALAEE162 pKa = 4.34CQALNPDD169 pKa = 3.64STDD172 pKa = 3.17NSSTSDD178 pKa = 3.63VEE180 pKa = 5.0DD181 pKa = 5.55DD182 pKa = 4.53GDD184 pKa = 4.43DD185 pKa = 3.8FCFLPDD191 pKa = 4.1IDD193 pKa = 5.69SLDD196 pKa = 3.57SDD198 pKa = 4.59QYY200 pKa = 12.01ADD202 pKa = 3.99DD203 pKa = 3.87
MM1 pKa = 7.07VAVCGVSPSMVVRR14 pKa = 11.84QPNVSLFEE22 pKa = 4.23GSQNLDD28 pKa = 2.98VGTVVIDD35 pKa = 3.62EE36 pKa = 4.85RR37 pKa = 11.84CFTWEE42 pKa = 3.78GQSRR46 pKa = 11.84QFSVPYY52 pKa = 9.78QQITLHH58 pKa = 6.88AISKK62 pKa = 9.42DD63 pKa = 3.34PVMAAGDD70 pKa = 3.67QPAPEE75 pKa = 4.04NTFPHH80 pKa = 6.17PHH82 pKa = 6.74LLVMIDD88 pKa = 3.25GDD90 pKa = 3.99RR91 pKa = 11.84PYY93 pKa = 11.17SPPHH97 pKa = 6.5PNGQIAGEE105 pKa = 3.97PMAIDD110 pKa = 3.98GAEE113 pKa = 4.06HH114 pKa = 7.22SDD116 pKa = 3.21TDD118 pKa = 3.96GSNEE122 pKa = 4.08SQEE125 pKa = 4.67DD126 pKa = 3.51ATSQGRR132 pKa = 11.84ASDD135 pKa = 4.22CPGEE139 pKa = 4.2TTILRR144 pKa = 11.84FVPQDD149 pKa = 3.54PNALDD154 pKa = 3.26TMYY157 pKa = 11.18AALAEE162 pKa = 4.34CQALNPDD169 pKa = 3.64STDD172 pKa = 3.17NSSTSDD178 pKa = 3.63VEE180 pKa = 5.0DD181 pKa = 5.55DD182 pKa = 4.53GDD184 pKa = 4.43DD185 pKa = 3.8FCFLPDD191 pKa = 4.1IDD193 pKa = 5.69SLDD196 pKa = 3.57SDD198 pKa = 4.59QYY200 pKa = 12.01ADD202 pKa = 3.99DD203 pKa = 3.87
Molecular weight: 21.86 kDa
Isoelectric point according different methods:
Protein with the highest isoelectric point:
>tr|A0A074ZIQ9|A0A074ZIQ9_9TREM Uncharacterized protein OS=Opisthorchis viverrini OX=6198 GN=T265_05731 PE=4 SV=1
KKK2 pKa = 10.54LTRR5 pKa = 11.84LLKKK9 pKa = 9.5LRR11 pKa = 11.84QPTTGCTLPLRR22 pKa = 11.84VHHH25 pKa = 6.24LLNDDD30 pKa = 3.33HH31 pKa = 6.71SSFKKK36 pKa = 10.01QRR38 pKa = 11.84IFNPMISRR46 pKa = 11.84NLVLRR51 pKa = 11.84RR52 pKa = 11.84RR53 pKa = 11.84FRR55 pKa = 11.84KKK57 pKa = 8.49IGPRR61 pKa = 11.84QFTRR65 pKa = 11.84FAGRR69 pKa = 11.84SPIAVSPVTGRR80 pKa = 11.84PLVSARR86 pKa = 11.84
KKK2 pKa = 10.54LTRR5 pKa = 11.84LLKKK9 pKa = 9.5LRR11 pKa = 11.84QPTTGCTLPLRR22 pKa = 11.84VHHH25 pKa = 6.24LLNDDD30 pKa = 3.33HH31 pKa = 6.71SSFKKK36 pKa = 10.01QRR38 pKa = 11.84IFNPMISRR46 pKa = 11.84NLVLRR51 pKa = 11.84RR52 pKa = 11.84RR53 pKa = 11.84FRR55 pKa = 11.84KKK57 pKa = 8.49IGPRR61 pKa = 11.84QFTRR65 pKa = 11.84FAGRR69 pKa = 11.84SPIAVSPVTGRR80 pKa = 11.84PLVSARR86 pKa = 11.84
Molecular weight: 10.0 kDa
Isoelectric point according different methods:
Peptides (in silico digests for buttom-up proteomics)
Below you can find in silico digests of the whole proteome with Trypsin, Chymotrypsin, Trypsin+LysC, LysN, ArgC proteases suitable for different mass spec machines.| Try ESI |
 |
|---|
| ChTry ESI |
 |
|---|
| ArgC ESI |
 |
|---|
| LysN ESI |
 |
|---|
| TryLysC ESI |
 |
|---|
| Try MALDI |
 |
|---|
| ChTry MALDI |
 |
|---|
| ArgC MALDI |
 |
|---|
| LysN MALDI |
 |
|---|
| TryLysC MALDI |
 |
|---|
| Try LTQ |
 |
|---|
| ChTry LTQ |
 |
|---|
| ArgC LTQ |
 |
|---|
| LysN LTQ |
 |
|---|
| TryLysC LTQ |
 |
|---|
| Try MSlow |
 |
|---|
| ChTry MSlow |
 |
|---|
| ArgC MSlow |
 |
|---|
| LysN MSlow |
 |
|---|
| TryLysC MSlow |
 |
|---|
| Try MShigh |
 |
|---|
| ChTry MShigh |
 |
|---|
| ArgC MShigh |
 |
|---|
| LysN MShigh |
 |
|---|
| TryLysC MShigh |
 |
|---|
General Statistics
Number of major isoforms |
Number of additional isoforms |
Number of all proteins |
Number of amino acids |
Min. Seq. Length |
Max. Seq. Length |
Avg. Seq. Length |
Avg. Mol. Weight |
|---|---|---|---|---|---|---|---|
0 |
7070076 |
30 |
10941 |
433.6 |
48.42 |
Amino acid frequency
Ala |
Cys |
Asp |
Glu |
Phe |
Gly |
His |
Ile |
Lys |
Leu |
|---|---|---|---|---|---|---|---|---|---|
6.774 ± 0.016 | 2.182 ± 0.012 |
5.143 ± 0.022 | 5.729 ± 0.021 |
3.764 ± 0.014 | 5.554 ± 0.022 |
2.81 ± 0.009 | 4.619 ± 0.013 |
4.457 ± 0.019 | 9.814 ± 0.024 |
Met |
Asn |
Gln |
Pro |
Arg |
Ser |
Thr |
Val |
Trp |
Tyr |
|---|---|---|---|---|---|---|---|---|---|
2.041 ± 0.008 | 4.086 ± 0.011 |
6.018 ± 0.021 | 4.328 ± 0.012 |
6.664 ± 0.016 | 9.394 ± 0.033 |
6.424 ± 0.019 | 6.36 ± 0.016 |
1.207 ± 0.006 | 2.621 ± 0.011 |
Most of the basic statistics you can see at this page can be downloaded from this CSV file
Proteome-pI is available under Creative Commons Attribution-NoDerivs license, for more details see here
| Reference: Kozlowski LP. Proteome-pI 2.0: Proteome Isoelectric Point Database Update. Nucleic Acids Res. 2021, doi: 10.1093/nar/gkab944 | Contact: Lukasz P. Kozlowski |
