Maize white line mosaic Satellite virus (MWLMV) (Satellite maize white line mosaic virus)
Taxonomy: Viruses; Riboviria; Aumaivirus; Maize aumaivirus 1
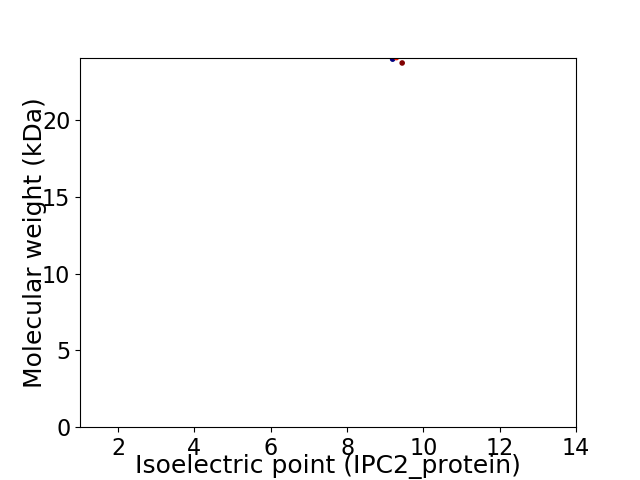
Average proteome isoelectric point is 9.14
Get precalculated fractions of proteins

Virtual 2D-PAGE plot for 1 proteins (isoelectric point calculated using IPC2_protein)
Get csv file with sequences according to given criteria:
* You can choose from 21 different methods for calculating isoelectric point
Summary statistics related to proteome-wise predictions


Protein with the lowest isoelectric point:
>sp|P29151|COAT_MWLMV Coat protein OS=Maize white line mosaic Satellite virus OX=31503 PE=4 SV=1
MM1 pKa = 7.33ATQLTTRR8 pKa = 11.84ARR10 pKa = 11.84RR11 pKa = 11.84ATRR14 pKa = 11.84VSRR17 pKa = 11.84KK18 pKa = 9.53GSQPASKK25 pKa = 10.36QDD27 pKa = 3.21VKK29 pKa = 11.23QVVKK33 pKa = 10.84SILGQSLEE41 pKa = 4.14HH42 pKa = 6.68KK43 pKa = 9.94RR44 pKa = 11.84ANLLLPPTVVNTTGNIYY61 pKa = 10.64CLTQFVIEE69 pKa = 4.6GDD71 pKa = 4.14GISQRR76 pKa = 11.84TGRR79 pKa = 11.84VINLEE84 pKa = 3.93QMVLRR89 pKa = 11.84YY90 pKa = 9.57RR91 pKa = 11.84RR92 pKa = 11.84TLDD95 pKa = 3.17TTSANSGFLRR105 pKa = 11.84YY106 pKa = 9.19IVFLDD111 pKa = 3.63TQNQGTLPAITDD123 pKa = 3.69VLSSLDD129 pKa = 3.38VSSGYY134 pKa = 10.2EE135 pKa = 3.74VLNAQQNRR143 pKa = 11.84FKK145 pKa = 11.03FLLDD149 pKa = 3.65EE150 pKa = 4.45VEE152 pKa = 4.53SLCASATNLSKK163 pKa = 11.2ASTLTFNQKK172 pKa = 9.22VQVHH176 pKa = 5.56YY177 pKa = 11.06GGAADD182 pKa = 3.86AATSNRR188 pKa = 11.84RR189 pKa = 11.84NAVFFLEE196 pKa = 5.03LSDD199 pKa = 4.58KK200 pKa = 10.94VATGPQTRR208 pKa = 11.84LGVQLKK214 pKa = 8.18FTDD217 pKa = 3.34AA218 pKa = 3.92
MM1 pKa = 7.33ATQLTTRR8 pKa = 11.84ARR10 pKa = 11.84RR11 pKa = 11.84ATRR14 pKa = 11.84VSRR17 pKa = 11.84KK18 pKa = 9.53GSQPASKK25 pKa = 10.36QDD27 pKa = 3.21VKK29 pKa = 11.23QVVKK33 pKa = 10.84SILGQSLEE41 pKa = 4.14HH42 pKa = 6.68KK43 pKa = 9.94RR44 pKa = 11.84ANLLLPPTVVNTTGNIYY61 pKa = 10.64CLTQFVIEE69 pKa = 4.6GDD71 pKa = 4.14GISQRR76 pKa = 11.84TGRR79 pKa = 11.84VINLEE84 pKa = 3.93QMVLRR89 pKa = 11.84YY90 pKa = 9.57RR91 pKa = 11.84RR92 pKa = 11.84TLDD95 pKa = 3.17TTSANSGFLRR105 pKa = 11.84YY106 pKa = 9.19IVFLDD111 pKa = 3.63TQNQGTLPAITDD123 pKa = 3.69VLSSLDD129 pKa = 3.38VSSGYY134 pKa = 10.2EE135 pKa = 3.74VLNAQQNRR143 pKa = 11.84FKK145 pKa = 11.03FLLDD149 pKa = 3.65EE150 pKa = 4.45VEE152 pKa = 4.53SLCASATNLSKK163 pKa = 11.2ASTLTFNQKK172 pKa = 9.22VQVHH176 pKa = 5.56YY177 pKa = 11.06GGAADD182 pKa = 3.86AATSNRR188 pKa = 11.84RR189 pKa = 11.84NAVFFLEE196 pKa = 5.03LSDD199 pKa = 4.58KK200 pKa = 10.94VATGPQTRR208 pKa = 11.84LGVQLKK214 pKa = 8.18FTDD217 pKa = 3.34AA218 pKa = 3.92
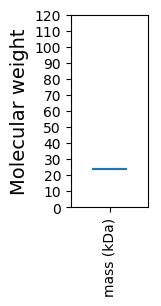
Molecular weight: 23.96 kDa
Isoelectric point according different methods:
Protein with the highest isoelectric point:
>sp|P29151|COAT_MWLMV Coat protein OS=Maize white line mosaic Satellite virus OX=31503 PE=4 SV=1
MM1 pKa = 7.33ATQLTTRR8 pKa = 11.84ARR10 pKa = 11.84RR11 pKa = 11.84ATRR14 pKa = 11.84VSRR17 pKa = 11.84KK18 pKa = 9.53GSQPASKK25 pKa = 10.36QDD27 pKa = 3.21VKK29 pKa = 11.23QVVKK33 pKa = 10.84SILGQSLEE41 pKa = 4.14HH42 pKa = 6.68KK43 pKa = 9.94RR44 pKa = 11.84ANLLLPPTVVNTTGNIYY61 pKa = 10.64CLTQFVIEE69 pKa = 4.6GDD71 pKa = 4.14GISQRR76 pKa = 11.84TGRR79 pKa = 11.84VINLEE84 pKa = 3.93QMVLRR89 pKa = 11.84YY90 pKa = 9.57RR91 pKa = 11.84RR92 pKa = 11.84TLDD95 pKa = 3.17TTSANSGFLRR105 pKa = 11.84YY106 pKa = 9.19IVFLDD111 pKa = 3.63TQNQGTLPAITDD123 pKa = 3.69VLSSLDD129 pKa = 3.38VSSGYY134 pKa = 10.2EE135 pKa = 3.74VLNAQQNRR143 pKa = 11.84FKK145 pKa = 11.03FLLDD149 pKa = 3.65EE150 pKa = 4.45VEE152 pKa = 4.53SLCASATNLSKK163 pKa = 11.2ASTLTFNQKK172 pKa = 9.22VQVHH176 pKa = 5.56YY177 pKa = 11.06GGAADD182 pKa = 3.86AATSNRR188 pKa = 11.84RR189 pKa = 11.84NAVFFLEE196 pKa = 5.03LSDD199 pKa = 4.58KK200 pKa = 10.94VATGPQTRR208 pKa = 11.84LGVQLKK214 pKa = 8.18FTDD217 pKa = 3.34AA218 pKa = 3.92
MM1 pKa = 7.33ATQLTTRR8 pKa = 11.84ARR10 pKa = 11.84RR11 pKa = 11.84ATRR14 pKa = 11.84VSRR17 pKa = 11.84KK18 pKa = 9.53GSQPASKK25 pKa = 10.36QDD27 pKa = 3.21VKK29 pKa = 11.23QVVKK33 pKa = 10.84SILGQSLEE41 pKa = 4.14HH42 pKa = 6.68KK43 pKa = 9.94RR44 pKa = 11.84ANLLLPPTVVNTTGNIYY61 pKa = 10.64CLTQFVIEE69 pKa = 4.6GDD71 pKa = 4.14GISQRR76 pKa = 11.84TGRR79 pKa = 11.84VINLEE84 pKa = 3.93QMVLRR89 pKa = 11.84YY90 pKa = 9.57RR91 pKa = 11.84RR92 pKa = 11.84TLDD95 pKa = 3.17TTSANSGFLRR105 pKa = 11.84YY106 pKa = 9.19IVFLDD111 pKa = 3.63TQNQGTLPAITDD123 pKa = 3.69VLSSLDD129 pKa = 3.38VSSGYY134 pKa = 10.2EE135 pKa = 3.74VLNAQQNRR143 pKa = 11.84FKK145 pKa = 11.03FLLDD149 pKa = 3.65EE150 pKa = 4.45VEE152 pKa = 4.53SLCASATNLSKK163 pKa = 11.2ASTLTFNQKK172 pKa = 9.22VQVHH176 pKa = 5.56YY177 pKa = 11.06GGAADD182 pKa = 3.86AATSNRR188 pKa = 11.84RR189 pKa = 11.84NAVFFLEE196 pKa = 5.03LSDD199 pKa = 4.58KK200 pKa = 10.94VATGPQTRR208 pKa = 11.84LGVQLKK214 pKa = 8.18FTDD217 pKa = 3.34AA218 pKa = 3.92
Molecular weight: 23.96 kDa
Isoelectric point according different methods:
Peptides (in silico digests for buttom-up proteomics)
Below you can find in silico digests of the whole proteome with Trypsin, Chymotrypsin, Trypsin+LysC, LysN, ArgC proteases suitable for different mass spec machines.| Try ESI |
 |
|---|
| ChTry ESI |
 |
|---|
| ArgC ESI |
 |
|---|
| LysN ESI |
 |
|---|
| TryLysC ESI |
 |
|---|
| Try MALDI |
 |
|---|
| ChTry MALDI |
 |
|---|
| ArgC MALDI |
 |
|---|
| LysN MALDI |
 |
|---|
| TryLysC MALDI |
 |
|---|
| Try LTQ |
 |
|---|
| ChTry LTQ |
 |
|---|
| ArgC LTQ |
 |
|---|
| LysN LTQ |
 |
|---|
| TryLysC LTQ |
 |
|---|
| Try MSlow |
 |
|---|
| ChTry MSlow |
 |
|---|
| ArgC MSlow |
 |
|---|
| LysN MSlow |
 |
|---|
| TryLysC MSlow |
 |
|---|
| Try MShigh |
 |
|---|
| ChTry MShigh |
 |
|---|
| ArgC MShigh |
 |
|---|
| LysN MShigh |
 |
|---|
| TryLysC MShigh |
 |
|---|
General Statistics
Number of major isoforms |
Number of additional isoforms |
Number of all proteins |
Number of amino acids |
Min. Seq. Length |
Max. Seq. Length |
Avg. Seq. Length |
Avg. Mol. Weight |
|---|---|---|---|---|---|---|---|
0 |
218 |
218 |
218 |
218.0 |
23.96 |
Amino acid frequency
Ala |
Cys |
Asp |
Glu |
Phe |
Gly |
His |
Ile |
Lys |
Leu |
|---|---|---|---|---|---|---|---|---|---|
8.257 ± 0.0 | 0.917 ± 0.0 |
4.587 ± 0.0 | 3.211 ± 0.0 |
4.128 ± 0.0 | 5.963 ± 0.0 |
0.917 ± 0.0 | 3.211 ± 0.0 |
4.587 ± 0.0 | 11.468 ± 0.0 |
Met |
Asn |
Gln |
Pro |
Arg |
Ser |
Thr |
Val |
Trp |
Tyr |
|---|---|---|---|---|---|---|---|---|---|
0.917 ± 0.0 | 5.505 ± 0.0 |
2.294 ± 0.0 | 7.339 ± 0.0 |
7.339 ± 0.0 | 8.257 ± 0.0 |
10.092 ± 0.0 | 8.716 ± 0.0 |
0.0 ± 0.0 | 2.294 ± 0.0 |
Most of the basic statistics you can see at this page can be downloaded from this CSV file
Proteome-pI is available under Creative Commons Attribution-NoDerivs license, for more details see here
| Reference: Kozlowski LP. Proteome-pI 2.0: Proteome Isoelectric Point Database Update. Nucleic Acids Res. 2021, doi: 10.1093/nar/gkab944 | Contact: Lukasz P. Kozlowski |
