Nodularia spumigena CCY9414
Taxonomy: cellular organisms; Bacteria; Terrabacteria group; Cyanobacteria/Melainabacteria group; Cyanobacteria; Nostocales; Aphanizomenonaceae; Nodularia; Nodularia spumigena
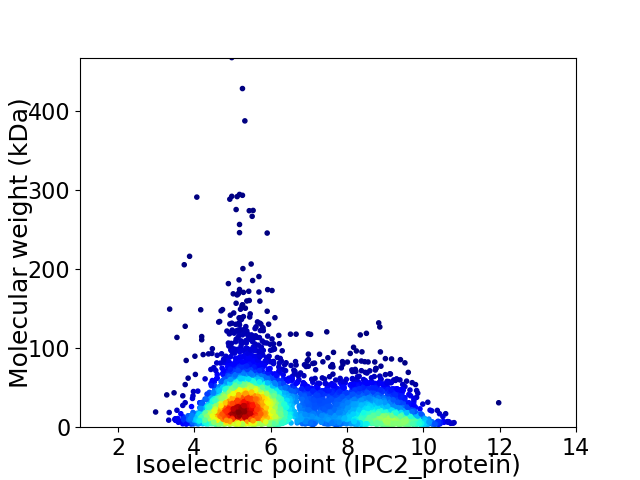
Average proteome isoelectric point is 6.41
Get precalculated fractions of proteins

Virtual 2D-PAGE plot for 5211 proteins (isoelectric point calculated using IPC2_protein)
Get csv file with sequences according to given criteria:
* You can choose from 21 different methods for calculating isoelectric point
Summary statistics related to proteome-wise predictions


Protein with the lowest isoelectric point:
>tr|A0ZCV3|A0ZCV3_NODSP Primosomal protein N' OS=Nodularia spumigena CCY9414 OX=313624 GN=priA PE=3 SV=1
MM1 pKa = 7.61LGNTTSPLIGNLTATNTFNQIPGAVEE27 pKa = 3.39PVNYY31 pKa = 10.59YY32 pKa = 10.07EE33 pKa = 5.23FSVFDD38 pKa = 3.28TSRR41 pKa = 11.84ISLVLSGITQNSAQASIIYY60 pKa = 9.7DD61 pKa = 3.5RR62 pKa = 11.84NNNRR66 pKa = 11.84LLDD69 pKa = 4.02SGEE72 pKa = 3.96RR73 pKa = 11.84LYY75 pKa = 11.35SQTAFVDD82 pKa = 3.26INGTINPTLGAGNYY96 pKa = 9.19LVEE99 pKa = 4.23IQRR102 pKa = 11.84FNSPNNNNYY111 pKa = 10.22SGYY114 pKa = 10.13SVQLSGTPTPASILSDD130 pKa = 3.42PGNTLNSAYY139 pKa = 10.8NIGNFNGTRR148 pKa = 11.84TFKK151 pKa = 10.86EE152 pKa = 4.01FVGVVDD158 pKa = 3.77PVDD161 pKa = 3.51YY162 pKa = 11.43YY163 pKa = 11.42KK164 pKa = 11.01FSLADD169 pKa = 3.3TSEE172 pKa = 3.85ISLLLSEE179 pKa = 4.48LTEE182 pKa = 4.31NALKK186 pKa = 10.19TSIISDD192 pKa = 3.64ANNNGLIDD200 pKa = 4.0SGEE203 pKa = 3.94SRR205 pKa = 11.84YY206 pKa = 8.67TDD208 pKa = 3.17TAQVNSNGTINANLAAGNYY227 pKa = 9.35LIAVEE232 pKa = 3.95QDD234 pKa = 3.36SANTNSNYY242 pKa = 10.78SLTLSNLTISTPKK255 pKa = 9.78AAKK258 pKa = 10.2DD259 pKa = 3.69FNQDD263 pKa = 2.89NQTDD267 pKa = 3.57ILLTKK272 pKa = 10.26PSEE275 pKa = 4.37GLNKK279 pKa = 9.84AWLMDD284 pKa = 3.17GTNYY288 pKa = 9.69VGEE291 pKa = 4.28MNLPGLAAYY300 pKa = 9.99RR301 pKa = 11.84PVATPDD307 pKa = 3.3FNKK310 pKa = 10.79DD311 pKa = 3.02GNTDD315 pKa = 4.07LLVSNPNNGWNLVWFLDD332 pKa = 3.47GMNYY336 pKa = 9.94VGGVGLPIAAGWEE349 pKa = 4.07IKK351 pKa = 10.32GAADD355 pKa = 3.9FNGDD359 pKa = 3.6GNVDD363 pKa = 3.01ILLNNTANNWNTVWFLGGDD382 pKa = 3.25NGATYY387 pKa = 9.63TGYY390 pKa = 11.51GNLPVAEE397 pKa = 4.69GWDD400 pKa = 3.41ITGVADD406 pKa = 4.45FNGDD410 pKa = 3.24GKK412 pKa = 11.14ADD414 pKa = 3.92LLLNNPTEE422 pKa = 4.32GWNSVWFLDD431 pKa = 3.55GTDD434 pKa = 3.61YY435 pKa = 10.87IGYY438 pKa = 9.16EE439 pKa = 4.26NLPSSPGWQSLGTGDD454 pKa = 4.36FNSDD458 pKa = 3.56GKK460 pKa = 10.19PDD462 pKa = 3.85IIMNNPTQGWNSIWLMDD479 pKa = 3.58GTNYY483 pKa = 10.33TGFASLPTTPDD494 pKa = 2.48GWEE497 pKa = 3.86IAGMAA502 pKa = 4.09
MM1 pKa = 7.61LGNTTSPLIGNLTATNTFNQIPGAVEE27 pKa = 3.39PVNYY31 pKa = 10.59YY32 pKa = 10.07EE33 pKa = 5.23FSVFDD38 pKa = 3.28TSRR41 pKa = 11.84ISLVLSGITQNSAQASIIYY60 pKa = 9.7DD61 pKa = 3.5RR62 pKa = 11.84NNNRR66 pKa = 11.84LLDD69 pKa = 4.02SGEE72 pKa = 3.96RR73 pKa = 11.84LYY75 pKa = 11.35SQTAFVDD82 pKa = 3.26INGTINPTLGAGNYY96 pKa = 9.19LVEE99 pKa = 4.23IQRR102 pKa = 11.84FNSPNNNNYY111 pKa = 10.22SGYY114 pKa = 10.13SVQLSGTPTPASILSDD130 pKa = 3.42PGNTLNSAYY139 pKa = 10.8NIGNFNGTRR148 pKa = 11.84TFKK151 pKa = 10.86EE152 pKa = 4.01FVGVVDD158 pKa = 3.77PVDD161 pKa = 3.51YY162 pKa = 11.43YY163 pKa = 11.42KK164 pKa = 11.01FSLADD169 pKa = 3.3TSEE172 pKa = 3.85ISLLLSEE179 pKa = 4.48LTEE182 pKa = 4.31NALKK186 pKa = 10.19TSIISDD192 pKa = 3.64ANNNGLIDD200 pKa = 4.0SGEE203 pKa = 3.94SRR205 pKa = 11.84YY206 pKa = 8.67TDD208 pKa = 3.17TAQVNSNGTINANLAAGNYY227 pKa = 9.35LIAVEE232 pKa = 3.95QDD234 pKa = 3.36SANTNSNYY242 pKa = 10.78SLTLSNLTISTPKK255 pKa = 9.78AAKK258 pKa = 10.2DD259 pKa = 3.69FNQDD263 pKa = 2.89NQTDD267 pKa = 3.57ILLTKK272 pKa = 10.26PSEE275 pKa = 4.37GLNKK279 pKa = 9.84AWLMDD284 pKa = 3.17GTNYY288 pKa = 9.69VGEE291 pKa = 4.28MNLPGLAAYY300 pKa = 9.99RR301 pKa = 11.84PVATPDD307 pKa = 3.3FNKK310 pKa = 10.79DD311 pKa = 3.02GNTDD315 pKa = 4.07LLVSNPNNGWNLVWFLDD332 pKa = 3.47GMNYY336 pKa = 9.94VGGVGLPIAAGWEE349 pKa = 4.07IKK351 pKa = 10.32GAADD355 pKa = 3.9FNGDD359 pKa = 3.6GNVDD363 pKa = 3.01ILLNNTANNWNTVWFLGGDD382 pKa = 3.25NGATYY387 pKa = 9.63TGYY390 pKa = 11.51GNLPVAEE397 pKa = 4.69GWDD400 pKa = 3.41ITGVADD406 pKa = 4.45FNGDD410 pKa = 3.24GKK412 pKa = 11.14ADD414 pKa = 3.92LLLNNPTEE422 pKa = 4.32GWNSVWFLDD431 pKa = 3.55GTDD434 pKa = 3.61YY435 pKa = 10.87IGYY438 pKa = 9.16EE439 pKa = 4.26NLPSSPGWQSLGTGDD454 pKa = 4.36FNSDD458 pKa = 3.56GKK460 pKa = 10.19PDD462 pKa = 3.85IIMNNPTQGWNSIWLMDD479 pKa = 3.58GTNYY483 pKa = 10.33TGFASLPTTPDD494 pKa = 2.48GWEE497 pKa = 3.86IAGMAA502 pKa = 4.09
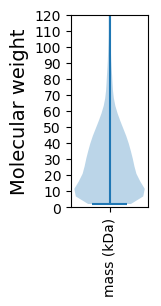
Molecular weight: 53.95 kDa
Isoelectric point according different methods:
Protein with the highest isoelectric point:
>tr|W6FP36|W6FP36_NODSP Uncharacterized protein OS=Nodularia spumigena CCY9414 OX=313624 GN=NSP_24780 PE=4 SV=1
MM1 pKa = 7.43TKK3 pKa = 10.56LGTSKK8 pKa = 10.45QKK10 pKa = 10.64NPQFVVGVRR19 pKa = 11.84TVVRR23 pKa = 11.84NPPLSFNLRR32 pKa = 11.84WVKK35 pKa = 10.61RR36 pKa = 11.84SLSPTTIFGG45 pKa = 3.52
MM1 pKa = 7.43TKK3 pKa = 10.56LGTSKK8 pKa = 10.45QKK10 pKa = 10.64NPQFVVGVRR19 pKa = 11.84TVVRR23 pKa = 11.84NPPLSFNLRR32 pKa = 11.84WVKK35 pKa = 10.61RR36 pKa = 11.84SLSPTTIFGG45 pKa = 3.52
Molecular weight: 5.09 kDa
Isoelectric point according different methods:
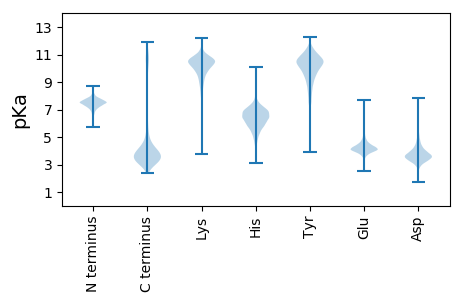
Peptides (in silico digests for buttom-up proteomics)
Below you can find in silico digests of the whole proteome with Trypsin, Chymotrypsin, Trypsin+LysC, LysN, ArgC proteases suitable for different mass spec machines.| Try ESI |
 |
|---|
| ChTry ESI |
 |
|---|
| ArgC ESI |
 |
|---|
| LysN ESI |
 |
|---|
| TryLysC ESI |
 |
|---|
| Try MALDI |
 |
|---|
| ChTry MALDI |
 |
|---|
| ArgC MALDI |
 |
|---|
| LysN MALDI |
 |
|---|
| TryLysC MALDI |
 |
|---|
| Try LTQ |
 |
|---|
| ChTry LTQ |
 |
|---|
| ArgC LTQ |
 |
|---|
| LysN LTQ |
 |
|---|
| TryLysC LTQ |
 |
|---|
| Try MSlow |
 |
|---|
| ChTry MSlow |
 |
|---|
| ArgC MSlow |
 |
|---|
| LysN MSlow |
 |
|---|
| TryLysC MSlow |
 |
|---|
| Try MShigh |
 |
|---|
| ChTry MShigh |
 |
|---|
| ArgC MShigh |
 |
|---|
| LysN MShigh |
 |
|---|
| TryLysC MShigh |
 |
|---|
General Statistics
Number of major isoforms |
Number of additional isoforms |
Number of all proteins |
Number of amino acids |
Min. Seq. Length |
Max. Seq. Length |
Avg. Seq. Length |
Avg. Mol. Weight |
|---|---|---|---|---|---|---|---|
0 |
1456987 |
17 |
4171 |
279.6 |
31.22 |
Amino acid frequency
Ala |
Cys |
Asp |
Glu |
Phe |
Gly |
His |
Ile |
Lys |
Leu |
|---|---|---|---|---|---|---|---|---|---|
7.902 ± 0.045 | 0.994 ± 0.013 |
4.773 ± 0.025 | 6.344 ± 0.036 |
3.976 ± 0.024 | 6.585 ± 0.039 |
1.91 ± 0.018 | 6.919 ± 0.031 |
4.846 ± 0.033 | 10.981 ± 0.039 |
Met |
Asn |
Gln |
Pro |
Arg |
Ser |
Thr |
Val |
Trp |
Tyr |
|---|---|---|---|---|---|---|---|---|---|
1.933 ± 0.016 | 4.473 ± 0.027 |
4.81 ± 0.028 | 5.553 ± 0.033 |
4.99 ± 0.026 | 6.321 ± 0.028 |
5.663 ± 0.032 | 6.559 ± 0.032 |
1.416 ± 0.017 | 3.052 ± 0.021 |
Most of the basic statistics you can see at this page can be downloaded from this CSV file
Proteome-pI is available under Creative Commons Attribution-NoDerivs license, for more details see here
| Reference: Kozlowski LP. Proteome-pI 2.0: Proteome Isoelectric Point Database Update. Nucleic Acids Res. 2021, doi: 10.1093/nar/gkab944 | Contact: Lukasz P. Kozlowski |
