Johnsongrass chlorotic stripe mosaic virus
Taxonomy: Viruses; Riboviria; Orthornavirae; Kitrinoviricota; Tolucaviricetes; Tolivirales; Tombusviridae; Procedovirinae; Aureusvirus
Average proteome isoelectric point is 8.12
Get precalculated fractions of proteins

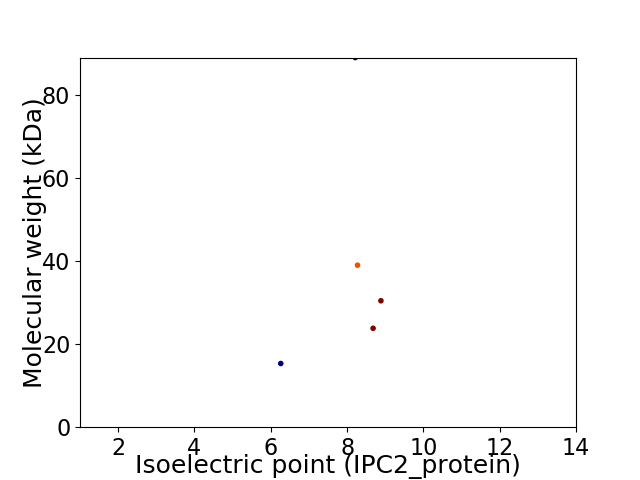
Virtual 2D-PAGE plot for 5 proteins (isoelectric point calculated using IPC2_protein)
Get csv file with sequences according to given criteria:
* You can choose from 21 different methods for calculating isoelectric point
Summary statistics related to proteome-wise predictions


Protein with the lowest isoelectric point:
>tr|Q70P83|Q70P83_9TOMB Putative movement protein OS=Johnsongrass chlorotic stripe mosaic virus OX=229149 GN=p24 PE=3 SV=1
MM1 pKa = 7.89EE2 pKa = 5.32GPKK5 pKa = 10.38DD6 pKa = 3.68WVLHH10 pKa = 4.52PHH12 pKa = 6.61RR13 pKa = 11.84CDD15 pKa = 3.35FCGHH19 pKa = 5.66ATYY22 pKa = 10.65LRR24 pKa = 11.84EE25 pKa = 4.24CWRR28 pKa = 11.84HH29 pKa = 6.15GSDD32 pKa = 3.0QVNRR36 pKa = 11.84HH37 pKa = 5.33EE38 pKa = 4.19RR39 pKa = 11.84HH40 pKa = 5.57EE41 pKa = 4.18PFPRR45 pKa = 11.84LVQVQGVQPGTWPDD59 pKa = 2.84IGRR62 pKa = 11.84VTTAVLPANRR72 pKa = 11.84GVSYY76 pKa = 8.27TLRR79 pKa = 11.84GHH81 pKa = 6.6GVTITVSGHH90 pKa = 5.4EE91 pKa = 3.57NDD93 pKa = 3.85VFNVARR99 pKa = 11.84VASDD103 pKa = 3.46VLTHH107 pKa = 6.3PVIQGEE113 pKa = 4.22ICVRR117 pKa = 11.84GSPPTGVGGGNQLPYY132 pKa = 10.7EE133 pKa = 4.33NQTNIVV139 pKa = 3.37
MM1 pKa = 7.89EE2 pKa = 5.32GPKK5 pKa = 10.38DD6 pKa = 3.68WVLHH10 pKa = 4.52PHH12 pKa = 6.61RR13 pKa = 11.84CDD15 pKa = 3.35FCGHH19 pKa = 5.66ATYY22 pKa = 10.65LRR24 pKa = 11.84EE25 pKa = 4.24CWRR28 pKa = 11.84HH29 pKa = 6.15GSDD32 pKa = 3.0QVNRR36 pKa = 11.84HH37 pKa = 5.33EE38 pKa = 4.19RR39 pKa = 11.84HH40 pKa = 5.57EE41 pKa = 4.18PFPRR45 pKa = 11.84LVQVQGVQPGTWPDD59 pKa = 2.84IGRR62 pKa = 11.84VTTAVLPANRR72 pKa = 11.84GVSYY76 pKa = 8.27TLRR79 pKa = 11.84GHH81 pKa = 6.6GVTITVSGHH90 pKa = 5.4EE91 pKa = 3.57NDD93 pKa = 3.85VFNVARR99 pKa = 11.84VASDD103 pKa = 3.46VLTHH107 pKa = 6.3PVIQGEE113 pKa = 4.22ICVRR117 pKa = 11.84GSPPTGVGGGNQLPYY132 pKa = 10.7EE133 pKa = 4.33NQTNIVV139 pKa = 3.37
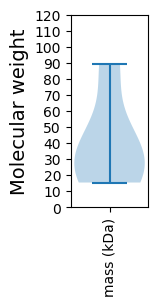
Molecular weight: 15.35 kDa
Isoelectric point according different methods:
Protein with the highest isoelectric point:
>tr|Q70P86|Q70P86_9TOMB RNA-directed RNA polymerase OS=Johnsongrass chlorotic stripe mosaic virus OX=229149 PE=3 SV=1
MM1 pKa = 7.76DD2 pKa = 3.95TGILSRR8 pKa = 11.84RR9 pKa = 11.84IVTAEE14 pKa = 3.44VDD16 pKa = 4.13FQFGSVDD23 pKa = 3.38YY24 pKa = 9.92SDD26 pKa = 4.02PRR28 pKa = 11.84IVHH31 pKa = 6.6ALCTPGLKK39 pKa = 9.78EE40 pKa = 3.37RR41 pKa = 11.84ATFGRR46 pKa = 11.84QIVTALKK53 pKa = 9.06MAVIALTLPVWWPLRR68 pKa = 11.84LVWRR72 pKa = 11.84VIIMGVLWVTRR83 pKa = 11.84FXTRR87 pKa = 11.84CTNLIKK93 pKa = 10.2WCVKK97 pKa = 5.9EE98 pKa = 4.02TRR100 pKa = 11.84VTVRR104 pKa = 11.84AYY106 pKa = 9.71WNILNKK112 pKa = 9.85RR113 pKa = 11.84ARR115 pKa = 11.84GLVVLGCWASFVLYY129 pKa = 10.54GPYY132 pKa = 10.87ALLLWLGVIVGYY144 pKa = 9.44IICVLPSNVRR154 pKa = 11.84YY155 pKa = 10.07YY156 pKa = 10.25IEE158 pKa = 5.12LGQKK162 pKa = 9.0IQDD165 pKa = 3.11AWDD168 pKa = 3.52SVEE171 pKa = 4.85ADD173 pKa = 3.76DD174 pKa = 6.08TIEE177 pKa = 4.29APCNGDD183 pKa = 2.97ILEE186 pKa = 4.17VRR188 pKa = 11.84KK189 pKa = 10.19GRR191 pKa = 11.84NKK193 pKa = 9.85FACKK197 pKa = 9.87LAARR201 pKa = 11.84AIGRR205 pKa = 11.84VGLLKK210 pKa = 9.95ATPANALVYY219 pKa = 10.31QKK221 pKa = 11.18VILDD225 pKa = 3.4EE226 pKa = 4.15MKK228 pKa = 10.24ILNVRR233 pKa = 11.84FADD236 pKa = 3.85RR237 pKa = 11.84VRR239 pKa = 11.84ILPLAVMASLDD250 pKa = 3.71RR251 pKa = 11.84PDD253 pKa = 3.31AVARR257 pKa = 11.84VEE259 pKa = 4.26DD260 pKa = 4.32CVAALTQRR268 pKa = 11.84GVSLL272 pKa = 3.89
MM1 pKa = 7.76DD2 pKa = 3.95TGILSRR8 pKa = 11.84RR9 pKa = 11.84IVTAEE14 pKa = 3.44VDD16 pKa = 4.13FQFGSVDD23 pKa = 3.38YY24 pKa = 9.92SDD26 pKa = 4.02PRR28 pKa = 11.84IVHH31 pKa = 6.6ALCTPGLKK39 pKa = 9.78EE40 pKa = 3.37RR41 pKa = 11.84ATFGRR46 pKa = 11.84QIVTALKK53 pKa = 9.06MAVIALTLPVWWPLRR68 pKa = 11.84LVWRR72 pKa = 11.84VIIMGVLWVTRR83 pKa = 11.84FXTRR87 pKa = 11.84CTNLIKK93 pKa = 10.2WCVKK97 pKa = 5.9EE98 pKa = 4.02TRR100 pKa = 11.84VTVRR104 pKa = 11.84AYY106 pKa = 9.71WNILNKK112 pKa = 9.85RR113 pKa = 11.84ARR115 pKa = 11.84GLVVLGCWASFVLYY129 pKa = 10.54GPYY132 pKa = 10.87ALLLWLGVIVGYY144 pKa = 9.44IICVLPSNVRR154 pKa = 11.84YY155 pKa = 10.07YY156 pKa = 10.25IEE158 pKa = 5.12LGQKK162 pKa = 9.0IQDD165 pKa = 3.11AWDD168 pKa = 3.52SVEE171 pKa = 4.85ADD173 pKa = 3.76DD174 pKa = 6.08TIEE177 pKa = 4.29APCNGDD183 pKa = 2.97ILEE186 pKa = 4.17VRR188 pKa = 11.84KK189 pKa = 10.19GRR191 pKa = 11.84NKK193 pKa = 9.85FACKK197 pKa = 9.87LAARR201 pKa = 11.84AIGRR205 pKa = 11.84VGLLKK210 pKa = 9.95ATPANALVYY219 pKa = 10.31QKK221 pKa = 11.18VILDD225 pKa = 3.4EE226 pKa = 4.15MKK228 pKa = 10.24ILNVRR233 pKa = 11.84FADD236 pKa = 3.85RR237 pKa = 11.84VRR239 pKa = 11.84ILPLAVMASLDD250 pKa = 3.71RR251 pKa = 11.84PDD253 pKa = 3.31AVARR257 pKa = 11.84VEE259 pKa = 4.26DD260 pKa = 4.32CVAALTQRR268 pKa = 11.84GVSLL272 pKa = 3.89
Molecular weight: 30.46 kDa
Isoelectric point according different methods:
Peptides (in silico digests for buttom-up proteomics)
Below you can find in silico digests of the whole proteome with Trypsin, Chymotrypsin, Trypsin+LysC, LysN, ArgC proteases suitable for different mass spec machines.| Try ESI |
 |
|---|
| ChTry ESI |
 |
|---|
| ArgC ESI |
 |
|---|
| LysN ESI |
 |
|---|
| TryLysC ESI |
 |
|---|
| Try MALDI |
 |
|---|
| ChTry MALDI |
 |
|---|
| ArgC MALDI |
 |
|---|
| LysN MALDI |
 |
|---|
| TryLysC MALDI |
 |
|---|
| Try LTQ |
 |
|---|
| ChTry LTQ |
 |
|---|
| ArgC LTQ |
 |
|---|
| LysN LTQ |
 |
|---|
| TryLysC LTQ |
 |
|---|
| Try MSlow |
 |
|---|
| ChTry MSlow |
 |
|---|
| ArgC MSlow |
 |
|---|
| LysN MSlow |
 |
|---|
| TryLysC MSlow |
 |
|---|
| Try MShigh |
 |
|---|
| ChTry MShigh |
 |
|---|
| ArgC MShigh |
 |
|---|
| LysN MShigh |
 |
|---|
| TryLysC MShigh |
 |
|---|
General Statistics
Number of major isoforms |
Number of additional isoforms |
Number of all proteins |
Number of amino acids |
Min. Seq. Length |
Max. Seq. Length |
Avg. Seq. Length |
Avg. Mol. Weight |
|---|---|---|---|---|---|---|---|
0 |
1787 |
139 |
795 |
357.4 |
39.54 |
Amino acid frequency
Ala |
Cys |
Asp |
Glu |
Phe |
Gly |
His |
Ile |
Lys |
Leu |
|---|---|---|---|---|---|---|---|---|---|
7.051 ± 0.916 | 2.462 ± 0.248 |
4.701 ± 0.564 | 4.141 ± 0.456 |
3.973 ± 0.539 | 8.45 ± 0.997 |
1.847 ± 0.657 | 4.253 ± 0.658 |
4.365 ± 0.829 | 9.01 ± 0.741 |
Met |
Asn |
Gln |
Pro |
Arg |
Ser |
Thr |
Val |
Trp |
Tyr |
|---|---|---|---|---|---|---|---|---|---|
2.071 ± 0.257 | 3.414 ± 0.69 |
5.204 ± 0.578 | 3.134 ± 0.482 |
7.051 ± 0.702 | 5.82 ± 0.931 |
6.715 ± 0.748 | 10.688 ± 0.651 |
2.071 ± 0.323 | 3.358 ± 0.337 |
Most of the basic statistics you can see at this page can be downloaded from this CSV file
Proteome-pI is available under Creative Commons Attribution-NoDerivs license, for more details see here
| Reference: Kozlowski LP. Proteome-pI 2.0: Proteome Isoelectric Point Database Update. Nucleic Acids Res. 2021, doi: 10.1093/nar/gkab944 | Contact: Lukasz P. Kozlowski |
