Nocardioides sp. dk884
Taxonomy: cellular organisms; Bacteria; Terrabacteria group; Actinobacteria; Actinomycetia; Propionibacteriales; Nocardioidaceae; Nocardioides; unclassified Nocardioides
Average proteome isoelectric point is 6.01
Get precalculated fractions of proteins

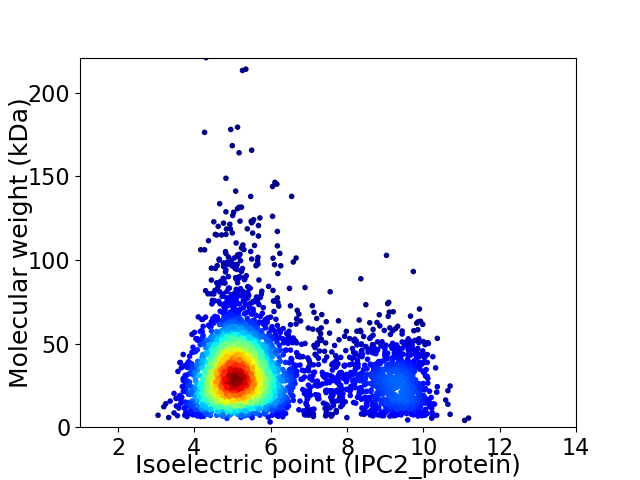
Virtual 2D-PAGE plot for 3911 proteins (isoelectric point calculated using IPC2_protein)
Get csv file with sequences according to given criteria:
* You can choose from 21 different methods for calculating isoelectric point
Summary statistics related to proteome-wise predictions


Protein with the lowest isoelectric point:
>tr|A0A5Q0NWX6|A0A5Q0NWX6_9ACTN Histidine kinase OS=Nocardioides sp. dk884 OX=2662361 GN=GFH29_12940 PE=4 SV=1
MM1 pKa = 7.74TIHH4 pKa = 6.85LHH6 pKa = 5.83RR7 pKa = 11.84VAALGAALILGAGSFAACGANDD29 pKa = 4.4DD30 pKa = 5.17NSDD33 pKa = 3.53NDD35 pKa = 3.94TGDD38 pKa = 3.43GGGGGGDD45 pKa = 3.5SASGGTIALLLPEE58 pKa = 4.87SKK60 pKa = 7.49TTRR63 pKa = 11.84YY64 pKa = 9.33EE65 pKa = 4.29AFDD68 pKa = 3.81KK69 pKa = 10.97PLFEE73 pKa = 5.11AKK75 pKa = 9.97VAEE78 pKa = 4.32LCPDD82 pKa = 3.91CEE84 pKa = 3.85VDD86 pKa = 5.47YY87 pKa = 11.79YY88 pKa = 11.64NADD91 pKa = 3.31QDD93 pKa = 4.02EE94 pKa = 4.48QKK96 pKa = 10.32QAQQVTSALTAGADD110 pKa = 3.67VMVLDD115 pKa = 4.85PVNGDD120 pKa = 3.2GATGMVQEE128 pKa = 4.86AQGQDD133 pKa = 3.61VPVIAYY139 pKa = 9.85DD140 pKa = 3.76RR141 pKa = 11.84FIEE144 pKa = 4.56GADD147 pKa = 3.48YY148 pKa = 11.62YY149 pKa = 10.99MSFDD153 pKa = 3.72NQTVGQMQAEE163 pKa = 4.23ALVEE167 pKa = 4.08AVGDD171 pKa = 3.71TGSILMLNGDD181 pKa = 4.45PKK183 pKa = 11.19DD184 pKa = 3.71PNAGQFKK191 pKa = 10.57AGAHH195 pKa = 5.48SVLDD199 pKa = 3.92EE200 pKa = 4.62SGVEE204 pKa = 4.06VLAEE208 pKa = 3.99YY209 pKa = 10.6DD210 pKa = 3.69NPDD213 pKa = 3.38WSPEE217 pKa = 3.82NAQQWTTDD225 pKa = 3.44QLSKK229 pKa = 10.98FEE231 pKa = 4.24PSEE234 pKa = 3.88IVGVYY239 pKa = 9.49AANDD243 pKa = 3.92GQAGGVVAAMTGAGVARR260 pKa = 11.84NQLPPITGQDD270 pKa = 3.26AEE272 pKa = 4.41VAAIQRR278 pKa = 11.84ILAGEE283 pKa = 3.94QAMTIYY289 pKa = 10.59KK290 pKa = 9.74PIAIEE295 pKa = 4.19AEE297 pKa = 4.12TAAEE301 pKa = 4.22VAVQLANGEE310 pKa = 4.43EE311 pKa = 4.21PGATSDD317 pKa = 3.76TGIDD321 pKa = 3.28QSDD324 pKa = 3.93FEE326 pKa = 5.19GVTSYY331 pKa = 10.9IFDD334 pKa = 5.53PIVVTSDD341 pKa = 2.93NVADD345 pKa = 3.91TVIADD350 pKa = 4.2GFYY353 pKa = 9.81TAEE356 pKa = 4.99DD357 pKa = 3.82ICTGDD362 pKa = 3.51YY363 pKa = 11.36AKK365 pKa = 10.87ACAEE369 pKa = 4.13AGISS373 pKa = 3.45
MM1 pKa = 7.74TIHH4 pKa = 6.85LHH6 pKa = 5.83RR7 pKa = 11.84VAALGAALILGAGSFAACGANDD29 pKa = 4.4DD30 pKa = 5.17NSDD33 pKa = 3.53NDD35 pKa = 3.94TGDD38 pKa = 3.43GGGGGGDD45 pKa = 3.5SASGGTIALLLPEE58 pKa = 4.87SKK60 pKa = 7.49TTRR63 pKa = 11.84YY64 pKa = 9.33EE65 pKa = 4.29AFDD68 pKa = 3.81KK69 pKa = 10.97PLFEE73 pKa = 5.11AKK75 pKa = 9.97VAEE78 pKa = 4.32LCPDD82 pKa = 3.91CEE84 pKa = 3.85VDD86 pKa = 5.47YY87 pKa = 11.79YY88 pKa = 11.64NADD91 pKa = 3.31QDD93 pKa = 4.02EE94 pKa = 4.48QKK96 pKa = 10.32QAQQVTSALTAGADD110 pKa = 3.67VMVLDD115 pKa = 4.85PVNGDD120 pKa = 3.2GATGMVQEE128 pKa = 4.86AQGQDD133 pKa = 3.61VPVIAYY139 pKa = 9.85DD140 pKa = 3.76RR141 pKa = 11.84FIEE144 pKa = 4.56GADD147 pKa = 3.48YY148 pKa = 11.62YY149 pKa = 10.99MSFDD153 pKa = 3.72NQTVGQMQAEE163 pKa = 4.23ALVEE167 pKa = 4.08AVGDD171 pKa = 3.71TGSILMLNGDD181 pKa = 4.45PKK183 pKa = 11.19DD184 pKa = 3.71PNAGQFKK191 pKa = 10.57AGAHH195 pKa = 5.48SVLDD199 pKa = 3.92EE200 pKa = 4.62SGVEE204 pKa = 4.06VLAEE208 pKa = 3.99YY209 pKa = 10.6DD210 pKa = 3.69NPDD213 pKa = 3.38WSPEE217 pKa = 3.82NAQQWTTDD225 pKa = 3.44QLSKK229 pKa = 10.98FEE231 pKa = 4.24PSEE234 pKa = 3.88IVGVYY239 pKa = 9.49AANDD243 pKa = 3.92GQAGGVVAAMTGAGVARR260 pKa = 11.84NQLPPITGQDD270 pKa = 3.26AEE272 pKa = 4.41VAAIQRR278 pKa = 11.84ILAGEE283 pKa = 3.94QAMTIYY289 pKa = 10.59KK290 pKa = 9.74PIAIEE295 pKa = 4.19AEE297 pKa = 4.12TAAEE301 pKa = 4.22VAVQLANGEE310 pKa = 4.43EE311 pKa = 4.21PGATSDD317 pKa = 3.76TGIDD321 pKa = 3.28QSDD324 pKa = 3.93FEE326 pKa = 5.19GVTSYY331 pKa = 10.9IFDD334 pKa = 5.53PIVVTSDD341 pKa = 2.93NVADD345 pKa = 3.91TVIADD350 pKa = 4.2GFYY353 pKa = 9.81TAEE356 pKa = 4.99DD357 pKa = 3.82ICTGDD362 pKa = 3.51YY363 pKa = 11.36AKK365 pKa = 10.87ACAEE369 pKa = 4.13AGISS373 pKa = 3.45
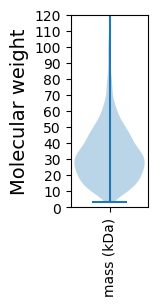
Molecular weight: 38.61 kDa
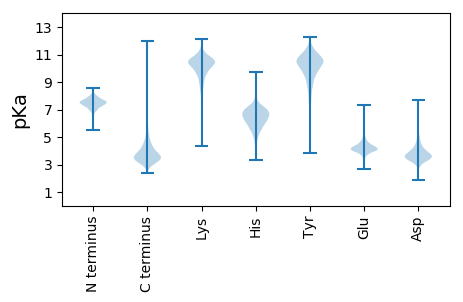
Isoelectric point according different methods:
Protein with the highest isoelectric point:
>tr|A0A5Q0NQD3|A0A5Q0NQD3_9ACTN TetR family transcriptional regulator OS=Nocardioides sp. dk884 OX=2662361 GN=GFH29_03880 PE=4 SV=1
MM1 pKa = 7.4GSVIKK6 pKa = 10.42KK7 pKa = 8.47RR8 pKa = 11.84RR9 pKa = 11.84KK10 pKa = 9.22RR11 pKa = 11.84MAKK14 pKa = 9.41KK15 pKa = 9.99KK16 pKa = 9.77HH17 pKa = 5.81RR18 pKa = 11.84KK19 pKa = 8.51LLKK22 pKa = 8.15KK23 pKa = 9.24TRR25 pKa = 11.84VQRR28 pKa = 11.84RR29 pKa = 11.84KK30 pKa = 10.07LGKK33 pKa = 9.87
MM1 pKa = 7.4GSVIKK6 pKa = 10.42KK7 pKa = 8.47RR8 pKa = 11.84RR9 pKa = 11.84KK10 pKa = 9.22RR11 pKa = 11.84MAKK14 pKa = 9.41KK15 pKa = 9.99KK16 pKa = 9.77HH17 pKa = 5.81RR18 pKa = 11.84KK19 pKa = 8.51LLKK22 pKa = 8.15KK23 pKa = 9.24TRR25 pKa = 11.84VQRR28 pKa = 11.84RR29 pKa = 11.84KK30 pKa = 10.07LGKK33 pKa = 9.87
Molecular weight: 4.07 kDa
Isoelectric point according different methods:
Peptides (in silico digests for buttom-up proteomics)
Below you can find in silico digests of the whole proteome with Trypsin, Chymotrypsin, Trypsin+LysC, LysN, ArgC proteases suitable for different mass spec machines.| Try ESI |
 |
|---|
| ChTry ESI |
 |
|---|
| ArgC ESI |
 |
|---|
| LysN ESI |
 |
|---|
| TryLysC ESI |
 |
|---|
| Try MALDI |
 |
|---|
| ChTry MALDI |
 |
|---|
| ArgC MALDI |
 |
|---|
| LysN MALDI |
 |
|---|
| TryLysC MALDI |
 |
|---|
| Try LTQ |
 |
|---|
| ChTry LTQ |
 |
|---|
| ArgC LTQ |
 |
|---|
| LysN LTQ |
 |
|---|
| TryLysC LTQ |
 |
|---|
| Try MSlow |
 |
|---|
| ChTry MSlow |
 |
|---|
| ArgC MSlow |
 |
|---|
| LysN MSlow |
 |
|---|
| TryLysC MSlow |
 |
|---|
| Try MShigh |
 |
|---|
| ChTry MShigh |
 |
|---|
| ArgC MShigh |
 |
|---|
| LysN MShigh |
 |
|---|
| TryLysC MShigh |
 |
|---|
General Statistics
Number of major isoforms |
Number of additional isoforms |
Number of all proteins |
Number of amino acids |
Min. Seq. Length |
Max. Seq. Length |
Avg. Seq. Length |
Avg. Mol. Weight |
|---|---|---|---|---|---|---|---|
0 |
1273211 |
29 |
2092 |
325.5 |
34.83 |
Amino acid frequency
Ala |
Cys |
Asp |
Glu |
Phe |
Gly |
His |
Ile |
Lys |
Leu |
|---|---|---|---|---|---|---|---|---|---|
13.536 ± 0.053 | 0.737 ± 0.012 |
6.278 ± 0.028 | 6.071 ± 0.038 |
2.665 ± 0.02 | 9.247 ± 0.039 |
2.27 ± 0.024 | 3.263 ± 0.026 |
1.766 ± 0.026 | 10.441 ± 0.045 |
Met |
Asn |
Gln |
Pro |
Arg |
Ser |
Thr |
Val |
Trp |
Tyr |
|---|---|---|---|---|---|---|---|---|---|
1.794 ± 0.015 | 1.602 ± 0.02 |
5.756 ± 0.031 | 2.666 ± 0.018 |
8.015 ± 0.042 | 5.076 ± 0.025 |
5.958 ± 0.034 | 9.469 ± 0.034 |
1.512 ± 0.015 | 1.879 ± 0.017 |
Most of the basic statistics you can see at this page can be downloaded from this CSV file
Proteome-pI is available under Creative Commons Attribution-NoDerivs license, for more details see here
| Reference: Kozlowski LP. Proteome-pI 2.0: Proteome Isoelectric Point Database Update. Nucleic Acids Res. 2021, doi: 10.1093/nar/gkab944 | Contact: Lukasz P. Kozlowski |
