Nocardioides sp. YIM 123512
Taxonomy: cellular organisms; Bacteria; Terrabacteria group; Actinobacteria; Actinomycetia; Propionibacteriales; Nocardioidaceae; Nocardioides; unclassified Nocardioides
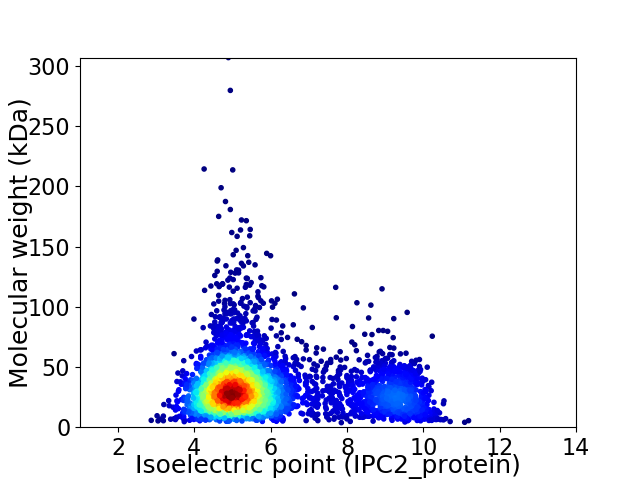
Average proteome isoelectric point is 5.93
Get precalculated fractions of proteins

Virtual 2D-PAGE plot for 4296 proteins (isoelectric point calculated using IPC2_protein)
Get csv file with sequences according to given criteria:
* You can choose from 21 different methods for calculating isoelectric point
Summary statistics related to proteome-wise predictions


Protein with the lowest isoelectric point:
>tr|A0A6L7F0F4|A0A6L7F0F4_9ACTN Uncharacterized protein OS=Nocardioides sp. YIM 123512 OX=2691959 GN=GRQ65_12095 PE=4 SV=1
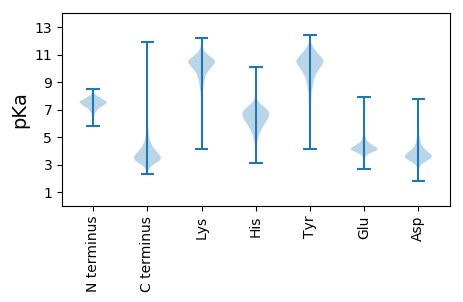
MM1 pKa = 7.47SEE3 pKa = 4.11RR4 pKa = 11.84FGRR7 pKa = 11.84LQKK10 pKa = 9.98ATALVPMAVLSAAVTAGLVGGQVPTPVAAPQSDD43 pKa = 3.39TSLPDD48 pKa = 3.27GTSIPAQAIEE58 pKa = 4.58APASVTGDD66 pKa = 3.28TAGTGTGVGDD76 pKa = 4.86LDD78 pKa = 3.85AQQVVATASTSGIPSAALAAYY99 pKa = 9.2QRR101 pKa = 11.84AEE103 pKa = 4.19TVINAADD110 pKa = 4.13PSCNLPWQLVAAIGRR125 pKa = 11.84VEE127 pKa = 4.46SNHH130 pKa = 5.47GRR132 pKa = 11.84ANGNTLSDD140 pKa = 4.59DD141 pKa = 3.84GVATPGIFGVALDD154 pKa = 3.9GTNRR158 pKa = 11.84TQEE161 pKa = 4.12IVDD164 pKa = 3.91TDD166 pKa = 3.18AGQYY170 pKa = 11.18DD171 pKa = 4.94DD172 pKa = 4.4DD173 pKa = 4.13TTYY176 pKa = 11.65DD177 pKa = 3.42RR178 pKa = 11.84AVGPMQFIPSTWAVVGVDD196 pKa = 3.29ADD198 pKa = 3.86GDD200 pKa = 4.35GVRR203 pKa = 11.84NPQDD207 pKa = 3.01IDD209 pKa = 3.59DD210 pKa = 4.73AALGTAVYY218 pKa = 10.01LCSGDD223 pKa = 5.04DD224 pKa = 4.98DD225 pKa = 5.78LGTDD229 pKa = 3.93AGRR232 pKa = 11.84QAAVYY237 pKa = 9.48RR238 pKa = 11.84YY239 pKa = 8.52NHH241 pKa = 5.56SQSYY245 pKa = 9.89VDD247 pKa = 4.67LVLAIMEE254 pKa = 4.91AYY256 pKa = 9.54MDD258 pKa = 4.34GDD260 pKa = 4.26FSSVPNSTVTAGEE273 pKa = 4.53PILPVPGYY281 pKa = 10.08DD282 pKa = 3.65PSPIKK287 pKa = 10.41QPQQYY292 pKa = 10.01QGNQQSQQPTQQPTEE307 pKa = 4.23APSEE311 pKa = 4.21QPTQQQQPTQQPTQQQQPTQQPTQNQNNQNNNQNQNNNQNQPQVPIATPTLPTLPSTQVAPVDD374 pKa = 4.01DD375 pKa = 4.55VLTAAQAITQCTLDD389 pKa = 4.13GVPILNTQAWQACLDD404 pKa = 4.03NYY406 pKa = 10.19TKK408 pKa = 11.1
MM1 pKa = 7.47SEE3 pKa = 4.11RR4 pKa = 11.84FGRR7 pKa = 11.84LQKK10 pKa = 9.98ATALVPMAVLSAAVTAGLVGGQVPTPVAAPQSDD43 pKa = 3.39TSLPDD48 pKa = 3.27GTSIPAQAIEE58 pKa = 4.58APASVTGDD66 pKa = 3.28TAGTGTGVGDD76 pKa = 4.86LDD78 pKa = 3.85AQQVVATASTSGIPSAALAAYY99 pKa = 9.2QRR101 pKa = 11.84AEE103 pKa = 4.19TVINAADD110 pKa = 4.13PSCNLPWQLVAAIGRR125 pKa = 11.84VEE127 pKa = 4.46SNHH130 pKa = 5.47GRR132 pKa = 11.84ANGNTLSDD140 pKa = 4.59DD141 pKa = 3.84GVATPGIFGVALDD154 pKa = 3.9GTNRR158 pKa = 11.84TQEE161 pKa = 4.12IVDD164 pKa = 3.91TDD166 pKa = 3.18AGQYY170 pKa = 11.18DD171 pKa = 4.94DD172 pKa = 4.4DD173 pKa = 4.13TTYY176 pKa = 11.65DD177 pKa = 3.42RR178 pKa = 11.84AVGPMQFIPSTWAVVGVDD196 pKa = 3.29ADD198 pKa = 3.86GDD200 pKa = 4.35GVRR203 pKa = 11.84NPQDD207 pKa = 3.01IDD209 pKa = 3.59DD210 pKa = 4.73AALGTAVYY218 pKa = 10.01LCSGDD223 pKa = 5.04DD224 pKa = 4.98DD225 pKa = 5.78LGTDD229 pKa = 3.93AGRR232 pKa = 11.84QAAVYY237 pKa = 9.48RR238 pKa = 11.84YY239 pKa = 8.52NHH241 pKa = 5.56SQSYY245 pKa = 9.89VDD247 pKa = 4.67LVLAIMEE254 pKa = 4.91AYY256 pKa = 9.54MDD258 pKa = 4.34GDD260 pKa = 4.26FSSVPNSTVTAGEE273 pKa = 4.53PILPVPGYY281 pKa = 10.08DD282 pKa = 3.65PSPIKK287 pKa = 10.41QPQQYY292 pKa = 10.01QGNQQSQQPTQQPTEE307 pKa = 4.23APSEE311 pKa = 4.21QPTQQQQPTQQPTQQQQPTQQPTQNQNNQNNNQNQNNNQNQPQVPIATPTLPTLPSTQVAPVDD374 pKa = 4.01DD375 pKa = 4.55VLTAAQAITQCTLDD389 pKa = 4.13GVPILNTQAWQACLDD404 pKa = 4.03NYY406 pKa = 10.19TKK408 pKa = 11.1
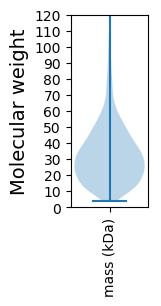
Molecular weight: 42.66 kDa
Isoelectric point according different methods:
Protein with the highest isoelectric point:
>tr|A0A6L7EWU7|A0A6L7EWU7_9ACTN Uncharacterized protein OS=Nocardioides sp. YIM 123512 OX=2691959 GN=GRQ65_03045 PE=4 SV=1
MM1 pKa = 7.4GSVIKK6 pKa = 10.42KK7 pKa = 8.47RR8 pKa = 11.84RR9 pKa = 11.84KK10 pKa = 9.22RR11 pKa = 11.84MAKK14 pKa = 9.41KK15 pKa = 9.99KK16 pKa = 9.77HH17 pKa = 5.81RR18 pKa = 11.84KK19 pKa = 8.51LLKK22 pKa = 8.15KK23 pKa = 9.24TRR25 pKa = 11.84VQRR28 pKa = 11.84RR29 pKa = 11.84KK30 pKa = 10.07LGKK33 pKa = 9.87
MM1 pKa = 7.4GSVIKK6 pKa = 10.42KK7 pKa = 8.47RR8 pKa = 11.84RR9 pKa = 11.84KK10 pKa = 9.22RR11 pKa = 11.84MAKK14 pKa = 9.41KK15 pKa = 9.99KK16 pKa = 9.77HH17 pKa = 5.81RR18 pKa = 11.84KK19 pKa = 8.51LLKK22 pKa = 8.15KK23 pKa = 9.24TRR25 pKa = 11.84VQRR28 pKa = 11.84RR29 pKa = 11.84KK30 pKa = 10.07LGKK33 pKa = 9.87
Molecular weight: 4.07 kDa
Isoelectric point according different methods:
Peptides (in silico digests for buttom-up proteomics)
Below you can find in silico digests of the whole proteome with Trypsin, Chymotrypsin, Trypsin+LysC, LysN, ArgC proteases suitable for different mass spec machines.| Try ESI |
 |
|---|
| ChTry ESI |
 |
|---|
| ArgC ESI |
 |
|---|
| LysN ESI |
 |
|---|
| TryLysC ESI |
 |
|---|
| Try MALDI |
 |
|---|
| ChTry MALDI |
 |
|---|
| ArgC MALDI |
 |
|---|
| LysN MALDI |
 |
|---|
| TryLysC MALDI |
 |
|---|
| Try LTQ |
 |
|---|
| ChTry LTQ |
 |
|---|
| ArgC LTQ |
 |
|---|
| LysN LTQ |
 |
|---|
| TryLysC LTQ |
 |
|---|
| Try MSlow |
 |
|---|
| ChTry MSlow |
 |
|---|
| ArgC MSlow |
 |
|---|
| LysN MSlow |
 |
|---|
| TryLysC MSlow |
 |
|---|
| Try MShigh |
 |
|---|
| ChTry MShigh |
 |
|---|
| ArgC MShigh |
 |
|---|
| LysN MShigh |
 |
|---|
| TryLysC MShigh |
 |
|---|
General Statistics
Number of major isoforms |
Number of additional isoforms |
Number of all proteins |
Number of amino acids |
Min. Seq. Length |
Max. Seq. Length |
Avg. Seq. Length |
Avg. Mol. Weight |
|---|---|---|---|---|---|---|---|
0 |
1402411 |
33 |
2903 |
326.4 |
34.81 |
Amino acid frequency
Ala |
Cys |
Asp |
Glu |
Phe |
Gly |
His |
Ile |
Lys |
Leu |
|---|---|---|---|---|---|---|---|---|---|
13.415 ± 0.07 | 0.703 ± 0.01 |
6.477 ± 0.032 | 5.786 ± 0.044 |
2.657 ± 0.023 | 9.36 ± 0.035 |
2.158 ± 0.021 | 2.895 ± 0.03 |
1.713 ± 0.026 | 10.332 ± 0.047 |
Met |
Asn |
Gln |
Pro |
Arg |
Ser |
Thr |
Val |
Trp |
Tyr |
|---|---|---|---|---|---|---|---|---|---|
1.648 ± 0.015 | 1.551 ± 0.023 |
5.676 ± 0.032 | 2.791 ± 0.021 |
7.813 ± 0.048 | 5.431 ± 0.028 |
6.292 ± 0.043 | 9.911 ± 0.046 |
1.519 ± 0.017 | 1.871 ± 0.021 |
Most of the basic statistics you can see at this page can be downloaded from this CSV file
Proteome-pI is available under Creative Commons Attribution-NoDerivs license, for more details see here
| Reference: Kozlowski LP. Proteome-pI 2.0: Proteome Isoelectric Point Database Update. Nucleic Acids Res. 2021, doi: 10.1093/nar/gkab944 | Contact: Lukasz P. Kozlowski |
