Oxobacter pfennigii
Taxonomy: cellular organisms; Bacteria; Terrabacteria group; Firmicutes; Clostridia; Eubacteriales; Clostridiaceae; Oxobacter
Average proteome isoelectric point is 6.38
Get precalculated fractions of proteins
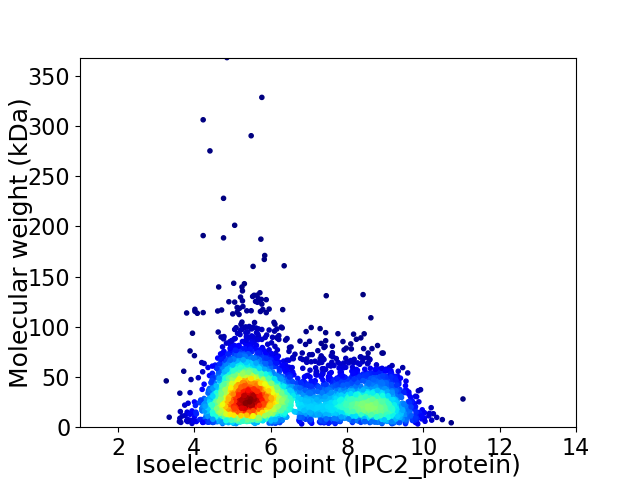
Virtual 2D-PAGE plot for 4273 proteins (isoelectric point calculated using IPC2_protein)
Get csv file with sequences according to given criteria:
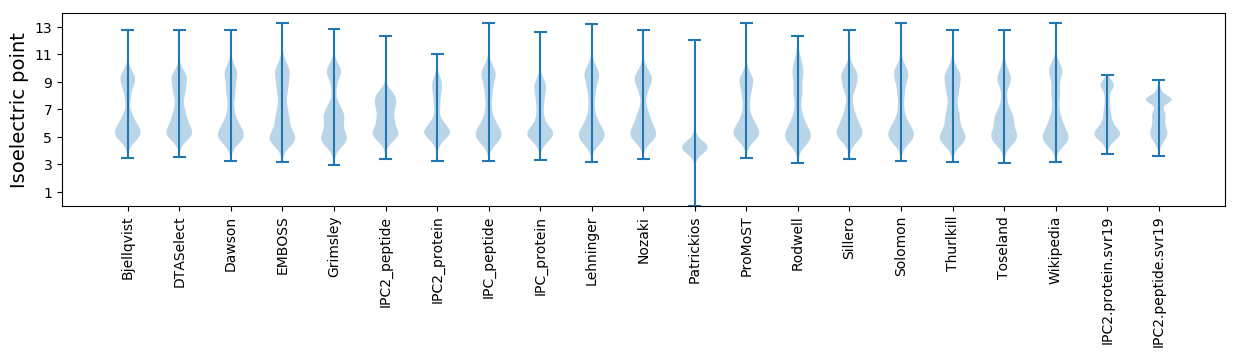
* You can choose from 21 different methods for calculating isoelectric point
Summary statistics related to proteome-wise predictions
Protein with the lowest isoelectric point:
>tr|A0A0P8X0T5|A0A0P8X0T5_9CLOT Electron transport complex subunit RsxG OS=Oxobacter pfennigii OX=36849 GN=rsxG_1 PE=4 SV=1
MM1 pKa = 7.46KK2 pKa = 10.79SMVKK6 pKa = 10.31GFRR9 pKa = 11.84SKK11 pKa = 10.84LALLMALVVVFSFSLSMTAFAAIDD35 pKa = 3.42TTVTVKK41 pKa = 10.21FYY43 pKa = 11.24NDD45 pKa = 3.28TVDD48 pKa = 4.4PDD50 pKa = 3.68VQLWTTRR57 pKa = 11.84TVEE60 pKa = 3.88YY61 pKa = 10.63DD62 pKa = 3.3SAVPVSKK69 pKa = 10.16PYY71 pKa = 10.97LPGGYY76 pKa = 8.08TDD78 pKa = 4.42PLGGAASVYY87 pKa = 10.58DD88 pKa = 4.71AIFAAAEE95 pKa = 4.08QIRR98 pKa = 11.84ALPDD102 pKa = 3.51EE103 pKa = 5.03DD104 pKa = 5.48PEE106 pKa = 5.51IEE108 pKa = 4.51DD109 pKa = 4.16PPVVGWDD116 pKa = 3.38ANPAYY121 pKa = 9.64GDD123 pKa = 3.32PGGYY127 pKa = 8.93IEE129 pKa = 6.17AIGDD133 pKa = 3.76FVTWNDD139 pKa = 3.07YY140 pKa = 11.22DD141 pKa = 4.0YY142 pKa = 11.68DD143 pKa = 5.49PITGHH148 pKa = 6.78HH149 pKa = 6.12ISEE152 pKa = 4.62GEE154 pKa = 4.09GWVCTVIPDD163 pKa = 4.21GDD165 pKa = 4.09DD166 pKa = 3.76PYY168 pKa = 11.98DD169 pKa = 4.51PIQYY173 pKa = 8.22LTAEE177 pKa = 4.13ALEE180 pKa = 5.09DD181 pKa = 3.34GMEE184 pKa = 4.34IIFRR188 pKa = 11.84FQSYY192 pKa = 9.55RR193 pKa = 11.84YY194 pKa = 8.81EE195 pKa = 3.9WDD197 pKa = 3.45DD198 pKa = 3.32
MM1 pKa = 7.46KK2 pKa = 10.79SMVKK6 pKa = 10.31GFRR9 pKa = 11.84SKK11 pKa = 10.84LALLMALVVVFSFSLSMTAFAAIDD35 pKa = 3.42TTVTVKK41 pKa = 10.21FYY43 pKa = 11.24NDD45 pKa = 3.28TVDD48 pKa = 4.4PDD50 pKa = 3.68VQLWTTRR57 pKa = 11.84TVEE60 pKa = 3.88YY61 pKa = 10.63DD62 pKa = 3.3SAVPVSKK69 pKa = 10.16PYY71 pKa = 10.97LPGGYY76 pKa = 8.08TDD78 pKa = 4.42PLGGAASVYY87 pKa = 10.58DD88 pKa = 4.71AIFAAAEE95 pKa = 4.08QIRR98 pKa = 11.84ALPDD102 pKa = 3.51EE103 pKa = 5.03DD104 pKa = 5.48PEE106 pKa = 5.51IEE108 pKa = 4.51DD109 pKa = 4.16PPVVGWDD116 pKa = 3.38ANPAYY121 pKa = 9.64GDD123 pKa = 3.32PGGYY127 pKa = 8.93IEE129 pKa = 6.17AIGDD133 pKa = 3.76FVTWNDD139 pKa = 3.07YY140 pKa = 11.22DD141 pKa = 4.0YY142 pKa = 11.68DD143 pKa = 5.49PITGHH148 pKa = 6.78HH149 pKa = 6.12ISEE152 pKa = 4.62GEE154 pKa = 4.09GWVCTVIPDD163 pKa = 4.21GDD165 pKa = 4.09DD166 pKa = 3.76PYY168 pKa = 11.98DD169 pKa = 4.51PIQYY173 pKa = 8.22LTAEE177 pKa = 4.13ALEE180 pKa = 5.09DD181 pKa = 3.34GMEE184 pKa = 4.34IIFRR188 pKa = 11.84FQSYY192 pKa = 9.55RR193 pKa = 11.84YY194 pKa = 8.81EE195 pKa = 3.9WDD197 pKa = 3.45DD198 pKa = 3.32
Molecular weight: 21.97 kDa
Isoelectric point according different methods:
Protein with the highest isoelectric point:
>tr|A0A0N8NTP6|A0A0N8NTP6_9CLOT High-affinity zinc uptake system ATP-binding protein ZnuC OS=Oxobacter pfennigii OX=36849 GN=znuC_1 PE=4 SV=1
MM1 pKa = 7.41LLVLPVRR8 pKa = 11.84LALPATQVLLALLVLPARR26 pKa = 11.84LALPATQVLLALLVLPATQVLLALLVLPATQVLLAPLVLPAQLALPVTQVLLALLVLPARR86 pKa = 11.84LALPATQVLLALLVLPARR104 pKa = 11.84LALPVTQVLLALLVLPARR122 pKa = 11.84LALPVTQVLLALLVLPARR140 pKa = 11.84LALPATQVLLALLVLPARR158 pKa = 11.84LALPATQVLLALLALPAQLALPATRR183 pKa = 11.84VLLALLVLPARR194 pKa = 11.84LALPATQVLLALLVLPARR212 pKa = 11.84LALPATRR219 pKa = 11.84VLLALLALPARR230 pKa = 11.84LALPVTRR237 pKa = 11.84VLLALLALPARR248 pKa = 11.84LALPVLLLLVLSFPLQVDD266 pKa = 3.81LSPRR270 pKa = 3.43
MM1 pKa = 7.41LLVLPVRR8 pKa = 11.84LALPATQVLLALLVLPARR26 pKa = 11.84LALPATQVLLALLVLPATQVLLALLVLPATQVLLAPLVLPAQLALPVTQVLLALLVLPARR86 pKa = 11.84LALPATQVLLALLVLPARR104 pKa = 11.84LALPVTQVLLALLVLPARR122 pKa = 11.84LALPVTQVLLALLVLPARR140 pKa = 11.84LALPATQVLLALLVLPARR158 pKa = 11.84LALPATQVLLALLALPAQLALPATRR183 pKa = 11.84VLLALLVLPARR194 pKa = 11.84LALPATQVLLALLVLPARR212 pKa = 11.84LALPATRR219 pKa = 11.84VLLALLALPARR230 pKa = 11.84LALPVTRR237 pKa = 11.84VLLALLALPARR248 pKa = 11.84LALPVLLLLVLSFPLQVDD266 pKa = 3.81LSPRR270 pKa = 3.43
Molecular weight: 28.1 kDa
Isoelectric point according different methods:
Peptides (in silico digests for buttom-up proteomics)
Below you can find in silico digests of the whole proteome with Trypsin, Chymotrypsin, Trypsin+LysC, LysN, ArgC proteases suitable for different mass spec machines.| Try ESI |
 |
|---|
| ChTry ESI |
|
|---|
| ArgC ESI |
|
|---|
| LysN ESI |
|
|---|
| TryLysC ESI |
|
|---|
| Try MALDI |
|
|---|
| ChTry MALDI |
|
|---|
| ArgC MALDI |
|
|---|
| LysN MALDI |
|
|---|
| TryLysC MALDI |
|
|---|
| Try LTQ |
|
|---|
| ChTry LTQ |
|
|---|
| ArgC LTQ |
|
|---|
| LysN LTQ |
|
|---|
| TryLysC LTQ |
|
|---|
| Try MSlow |
|
|---|
| ChTry MSlow |
|
|---|
| ArgC MSlow |
|
|---|
| LysN MSlow |
|
|---|
| TryLysC MSlow |
|
|---|
| Try MShigh |
|
|---|
| ChTry MShigh |
|
|---|
| ArgC MShigh |
|
|---|
| LysN MShigh |
|
|---|
| TryLysC MShigh |
|
|---|
General Statistics
Number of major isoforms |
Number of additional isoforms |
Number of all proteins |
Number of amino acids |
Min. Seq. Length |
Max. Seq. Length |
Avg. Seq. Length |
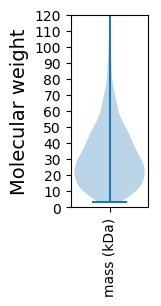
Avg. Mol. Weight |
|---|---|---|---|---|---|---|---|
0 |
1282805 |
30 |
3275 |
300.2 |
33.64 |
Amino acid frequency
Ala |
Cys |
Asp |
Glu |
Phe |
Gly |
His |
Ile |
Lys |
Leu |
|---|---|---|---|---|---|---|---|---|---|
6.883 ± 0.038 | 1.174 ± 0.019 |
5.619 ± 0.028 | 6.931 ± 0.044 |
4.302 ± 0.028 | 6.954 ± 0.038 |
1.513 ± 0.016 | 9.098 ± 0.048 |
7.687 ± 0.041 | 9.127 ± 0.041 |
Met |
Asn |
Gln |
Pro |
Arg |
Ser |
Thr |
Val |
Trp |
Tyr |
|---|---|---|---|---|---|---|---|---|---|
2.917 ± 0.019 | 5.106 ± 0.033 |
3.37 ± 0.024 | 2.623 ± 0.022 |
3.901 ± 0.027 | 6.362 ± 0.032 |
5.039 ± 0.038 | 6.496 ± 0.033 |
0.818 ± 0.013 | 4.08 ± 0.03 |
Most of the basic statistics you can see at this page can be downloaded from this CSV file
See this proteome in:

Proteome-pI is available under Creative Commons Attribution-NoDerivs license, for more details see here
| Reference: Kozlowski LP. Proteome-pI 2.0: Proteome Isoelectric Point Database Update. Nucleic Acids Res. 2021, doi: 10.1093/nar/gkab944 | Contact: Lukasz P. Kozlowski |