uncultured phage_MedDCM-OCT-S39-C11
Taxonomy: Viruses; Duplodnaviria; Heunggongvirae; Uroviricota; Caudoviricetes; Caudovirales; Autographiviridae; Krakvirus; Krakvirus S39C11
Average proteome isoelectric point is 6.03
Get precalculated fractions of proteins
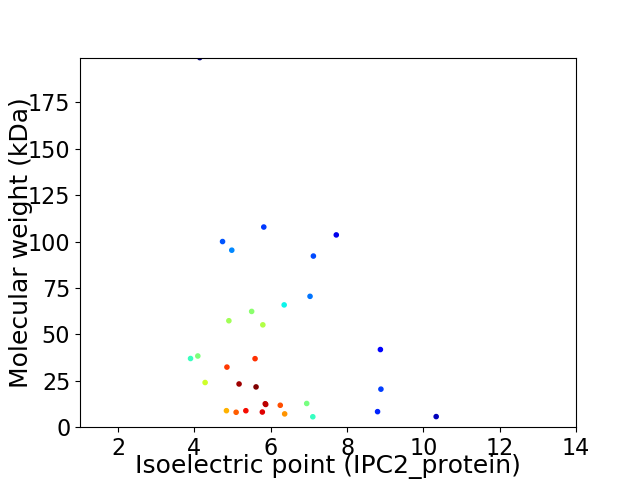
Virtual 2D-PAGE plot for 32 proteins (isoelectric point calculated using IPC2_protein)
Get csv file with sequences according to given criteria:
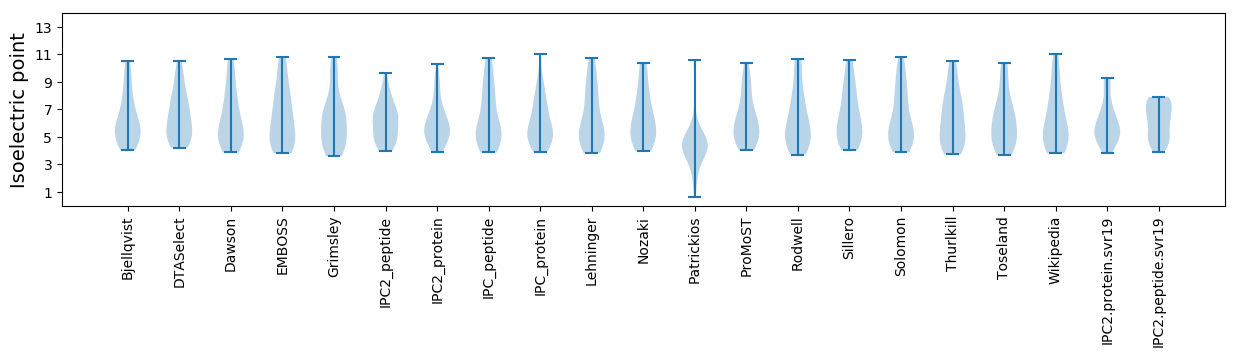
* You can choose from 21 different methods for calculating isoelectric point
Summary statistics related to proteome-wise predictions
Protein with the lowest isoelectric point:
>tr|A0A6S4PGY8|A0A6S4PGY8_9CAUD Endonuclease OS=uncultured phage_MedDCM-OCT-S39-C11 OX=2740805 PE=4 SV=1
MM1 pKa = 7.64EE2 pKa = 5.13LQEE5 pKa = 3.89AWRR8 pKa = 11.84DD9 pKa = 3.8VIRR12 pKa = 11.84PTMYY16 pKa = 10.43RR17 pKa = 11.84EE18 pKa = 3.96LKK20 pKa = 9.01TPGNKK25 pKa = 9.42GVEE28 pKa = 4.32VVMVEE33 pKa = 3.98AAGGDD38 pKa = 3.74TPEE41 pKa = 5.2PEE43 pKa = 4.91PEE45 pKa = 3.98RR46 pKa = 11.84QPITVTTGAAWADD59 pKa = 3.67LNDD62 pKa = 3.61YY63 pKa = 10.96SIGSEE68 pKa = 4.09VFADD72 pKa = 3.74VAAYY76 pKa = 8.93TGGNPDD82 pKa = 3.22TTTYY86 pKa = 10.28RR87 pKa = 11.84YY88 pKa = 9.47RR89 pKa = 11.84WQARR93 pKa = 11.84ATADD97 pKa = 3.75DD98 pKa = 3.88GWVNGSWTNYY108 pKa = 8.89NDD110 pKa = 3.37HH111 pKa = 7.36AMEE114 pKa = 4.17VSTTIAEE121 pKa = 4.38PGQLRR126 pKa = 11.84FQCQARR132 pKa = 11.84DD133 pKa = 3.54TSVDD137 pKa = 3.06PVEE140 pKa = 4.32QVNSFAAVKK149 pKa = 9.49TVDD152 pKa = 3.31TPAALVISTPVVTGEE167 pKa = 4.37PIVGYY172 pKa = 7.94TLTCSEE178 pKa = 4.37PTVSGGVGPYY188 pKa = 9.78QLDD191 pKa = 4.01YY192 pKa = 11.23FWVDD196 pKa = 3.02EE197 pKa = 4.48SNAIVWEE204 pKa = 3.98ATYY207 pKa = 9.87MGNTTKK213 pKa = 10.47IIDD216 pKa = 3.75YY217 pKa = 10.98DD218 pKa = 3.6LGKK221 pKa = 9.29TMKK224 pKa = 10.52CLVTVTDD231 pKa = 3.09KK232 pKa = 11.43GYY234 pKa = 11.22ARR236 pKa = 11.84GEE238 pKa = 4.32STTVQSNQLGPINRR252 pKa = 11.84PTLPDD257 pKa = 3.24YY258 pKa = 10.71EE259 pKa = 4.74VYY261 pKa = 11.03VDD263 pKa = 5.05GALHH267 pKa = 7.5DD268 pKa = 5.24DD269 pKa = 4.02PSADD273 pKa = 3.03VGVGINGTVVLEE285 pKa = 4.12VRR287 pKa = 11.84PEE289 pKa = 3.77AVAYY293 pKa = 8.26PPLDD297 pKa = 3.01IGYY300 pKa = 8.76SWQVRR305 pKa = 11.84NGTGRR310 pKa = 11.84LSGGTNGTSVMYY322 pKa = 7.28MAPDD326 pKa = 3.79SAPAGALVTCTATSNDD342 pKa = 3.71ASDD345 pKa = 3.14SAYY348 pKa = 10.38AAEE351 pKa = 4.27VTILVAEE358 pKa = 4.42
MM1 pKa = 7.64EE2 pKa = 5.13LQEE5 pKa = 3.89AWRR8 pKa = 11.84DD9 pKa = 3.8VIRR12 pKa = 11.84PTMYY16 pKa = 10.43RR17 pKa = 11.84EE18 pKa = 3.96LKK20 pKa = 9.01TPGNKK25 pKa = 9.42GVEE28 pKa = 4.32VVMVEE33 pKa = 3.98AAGGDD38 pKa = 3.74TPEE41 pKa = 5.2PEE43 pKa = 4.91PEE45 pKa = 3.98RR46 pKa = 11.84QPITVTTGAAWADD59 pKa = 3.67LNDD62 pKa = 3.61YY63 pKa = 10.96SIGSEE68 pKa = 4.09VFADD72 pKa = 3.74VAAYY76 pKa = 8.93TGGNPDD82 pKa = 3.22TTTYY86 pKa = 10.28RR87 pKa = 11.84YY88 pKa = 9.47RR89 pKa = 11.84WQARR93 pKa = 11.84ATADD97 pKa = 3.75DD98 pKa = 3.88GWVNGSWTNYY108 pKa = 8.89NDD110 pKa = 3.37HH111 pKa = 7.36AMEE114 pKa = 4.17VSTTIAEE121 pKa = 4.38PGQLRR126 pKa = 11.84FQCQARR132 pKa = 11.84DD133 pKa = 3.54TSVDD137 pKa = 3.06PVEE140 pKa = 4.32QVNSFAAVKK149 pKa = 9.49TVDD152 pKa = 3.31TPAALVISTPVVTGEE167 pKa = 4.37PIVGYY172 pKa = 7.94TLTCSEE178 pKa = 4.37PTVSGGVGPYY188 pKa = 9.78QLDD191 pKa = 4.01YY192 pKa = 11.23FWVDD196 pKa = 3.02EE197 pKa = 4.48SNAIVWEE204 pKa = 3.98ATYY207 pKa = 9.87MGNTTKK213 pKa = 10.47IIDD216 pKa = 3.75YY217 pKa = 10.98DD218 pKa = 3.6LGKK221 pKa = 9.29TMKK224 pKa = 10.52CLVTVTDD231 pKa = 3.09KK232 pKa = 11.43GYY234 pKa = 11.22ARR236 pKa = 11.84GEE238 pKa = 4.32STTVQSNQLGPINRR252 pKa = 11.84PTLPDD257 pKa = 3.24YY258 pKa = 10.71EE259 pKa = 4.74VYY261 pKa = 11.03VDD263 pKa = 5.05GALHH267 pKa = 7.5DD268 pKa = 5.24DD269 pKa = 4.02PSADD273 pKa = 3.03VGVGINGTVVLEE285 pKa = 4.12VRR287 pKa = 11.84PEE289 pKa = 3.77AVAYY293 pKa = 8.26PPLDD297 pKa = 3.01IGYY300 pKa = 8.76SWQVRR305 pKa = 11.84NGTGRR310 pKa = 11.84LSGGTNGTSVMYY322 pKa = 7.28MAPDD326 pKa = 3.79SAPAGALVTCTATSNDD342 pKa = 3.71ASDD345 pKa = 3.14SAYY348 pKa = 10.38AAEE351 pKa = 4.27VTILVAEE358 pKa = 4.42
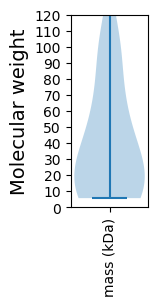
Molecular weight: 38.37 kDa
Isoelectric point according different methods:
Protein with the highest isoelectric point:
>tr|A0A6S4PA68|A0A6S4PA68_9CAUD Phage single-stranded DNA-binding protein OS=uncultured phage_MedDCM-OCT-S39-C11 OX=2740805 PE=4 SV=1
MM1 pKa = 7.59TGPIPLPKK9 pKa = 9.88QYY11 pKa = 9.59PAHH14 pKa = 6.64LVLTYY19 pKa = 10.34RR20 pKa = 11.84GVRR23 pKa = 11.84YY24 pKa = 9.71RR25 pKa = 11.84PAALQLFVARR35 pKa = 11.84GGWGRR40 pKa = 11.84DD41 pKa = 3.52YY42 pKa = 11.02VTTAPQHH49 pKa = 5.76LSS51 pKa = 3.12
MM1 pKa = 7.59TGPIPLPKK9 pKa = 9.88QYY11 pKa = 9.59PAHH14 pKa = 6.64LVLTYY19 pKa = 10.34RR20 pKa = 11.84GVRR23 pKa = 11.84YY24 pKa = 9.71RR25 pKa = 11.84PAALQLFVARR35 pKa = 11.84GGWGRR40 pKa = 11.84DD41 pKa = 3.52YY42 pKa = 11.02VTTAPQHH49 pKa = 5.76LSS51 pKa = 3.12
Molecular weight: 5.72 kDa
Isoelectric point according different methods:
Peptides (in silico digests for buttom-up proteomics)
Below you can find in silico digests of the whole proteome with Trypsin, Chymotrypsin, Trypsin+LysC, LysN, ArgC proteases suitable for different mass spec machines.| Try ESI |
 |
|---|
| ChTry ESI |
|
|---|
| ArgC ESI |
|
|---|
| LysN ESI |
|
|---|
| TryLysC ESI |
|
|---|
| Try MALDI |
|
|---|
| ChTry MALDI |
|
|---|
| ArgC MALDI |
|
|---|
| LysN MALDI |
|
|---|
| TryLysC MALDI |
|
|---|
| Try LTQ |
|
|---|
| ChTry LTQ |
|
|---|
| ArgC LTQ |
|
|---|
| LysN LTQ |
|
|---|
| TryLysC LTQ |
|
|---|
| Try MSlow |
|
|---|
| ChTry MSlow |
|
|---|
| ArgC MSlow |
|
|---|
| LysN MSlow |
|
|---|
| TryLysC MSlow |
|
|---|
| Try MShigh |
|
|---|
| ChTry MShigh |
|
|---|
| ArgC MShigh |
|
|---|
| LysN MShigh |
|
|---|
| TryLysC MShigh |
|
|---|
General Statistics
Number of major isoforms |
Number of additional isoforms |
Number of all proteins |
Number of amino acids |
Min. Seq. Length |
Max. Seq. Length |
Avg. Seq. Length |
Avg. Mol. Weight |
|---|---|---|---|---|---|---|---|
0 |
12754 |
51 |
1892 |
398.6 |
43.63 |
Amino acid frequency
Ala |
Cys |
Asp |
Glu |
Phe |
Gly |
His |
Ile |
Lys |
Leu |
|---|---|---|---|---|---|---|---|---|---|
9.652 ± 0.509 | 0.761 ± 0.167 |
6.398 ± 0.206 | 5.912 ± 0.32 |
3.223 ± 0.292 | 8.272 ± 0.569 |
0.941 ± 0.214 | 4.665 ± 0.239 |
4.893 ± 0.327 | 8.272 ± 0.456 |
Met |
Asn |
Gln |
Pro |
Arg |
Ser |
Thr |
Val |
Trp |
Tyr |
|---|---|---|---|---|---|---|---|---|---|
2.305 ± 0.343 | 4.869 ± 0.41 |
4.414 ± 0.29 | 5.018 ± 0.408 |
5.332 ± 0.54 | 7.033 ± 0.578 |
6.861 ± 0.595 | 6.5 ± 0.298 |
1.576 ± 0.226 | 3.105 ± 0.158 |
Most of the basic statistics you can see at this page can be downloaded from this CSV file
See this proteome in:

Proteome-pI is available under Creative Commons Attribution-NoDerivs license, for more details see here
| Reference: Kozlowski LP. Proteome-pI 2.0: Proteome Isoelectric Point Database Update. Nucleic Acids Res. 2021, doi: 10.1093/nar/gkab944 | Contact: Lukasz P. Kozlowski |