Polymorphobacter fuscus
Taxonomy: cellular organisms; Bacteria; Proteobacteria; Alphaproteobacteria; Sphingomonadales; Sphingosinicellaceae; Polymorphobacter
Average proteome isoelectric point is 6.74
Get precalculated fractions of proteins
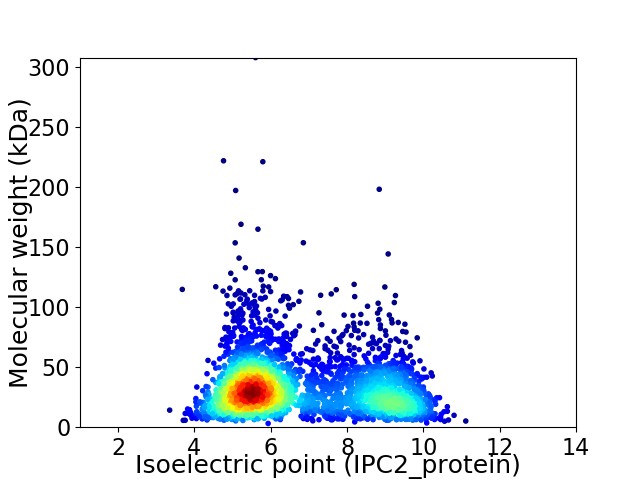
Virtual 2D-PAGE plot for 3101 proteins (isoelectric point calculated using IPC2_protein)
Get csv file with sequences according to given criteria:
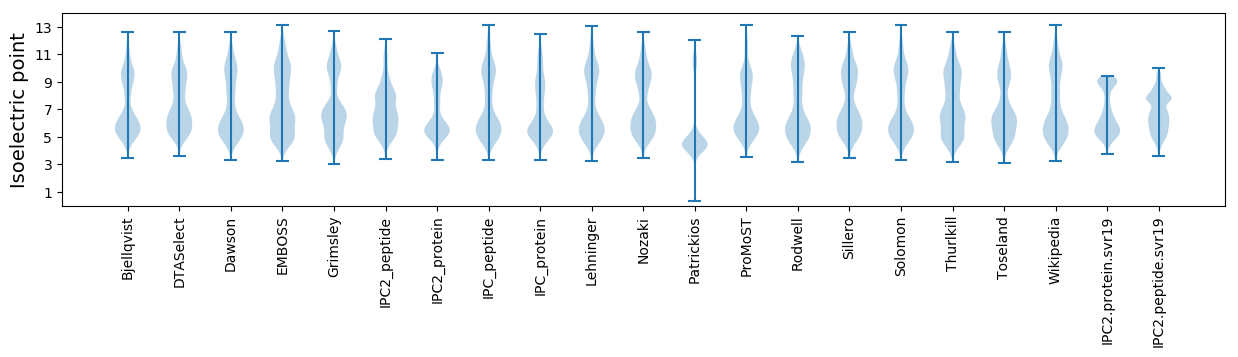
* You can choose from 21 different methods for calculating isoelectric point
Summary statistics related to proteome-wise predictions
Protein with the lowest isoelectric point:
>tr|A0A7C9KKI3|A0A7C9KKI3_9SPHN TonB-dependent receptor OS=Polymorphobacter fuscus OX=1439888 GN=F3168_04425 PE=3 SV=1
MM1 pKa = 7.64ALFNFGGQTVDD12 pKa = 4.65SSDD15 pKa = 3.79ADD17 pKa = 3.68ALAQAAQDD25 pKa = 3.42AGATFGGSIVAGNTYY40 pKa = 9.85GVSGGVVTGTVHH52 pKa = 7.71GDD54 pKa = 3.57EE55 pKa = 4.22QHH57 pKa = 7.16DD58 pKa = 3.63AA59 pKa = 3.87
MM1 pKa = 7.64ALFNFGGQTVDD12 pKa = 4.65SSDD15 pKa = 3.79ADD17 pKa = 3.68ALAQAAQDD25 pKa = 3.42AGATFGGSIVAGNTYY40 pKa = 9.85GVSGGVVTGTVHH52 pKa = 7.71GDD54 pKa = 3.57EE55 pKa = 4.22QHH57 pKa = 7.16DD58 pKa = 3.63AA59 pKa = 3.87
Molecular weight: 5.72 kDa
Isoelectric point according different methods:
Protein with the highest isoelectric point:
>tr|A0A7C9KWI1|A0A7C9KWI1_9SPHN Tryptophan-rich sensory protein OS=Polymorphobacter fuscus OX=1439888 GN=F3168_07005 PE=3 SV=1
MM1 pKa = 7.35KK2 pKa = 9.43RR3 pKa = 11.84TYY5 pKa = 10.27QPSKK9 pKa = 9.43LVRR12 pKa = 11.84ARR14 pKa = 11.84RR15 pKa = 11.84HH16 pKa = 4.38GFRR19 pKa = 11.84ARR21 pKa = 11.84MATVGGRR28 pKa = 11.84NVIRR32 pKa = 11.84NRR34 pKa = 11.84RR35 pKa = 11.84AQGRR39 pKa = 11.84KK40 pKa = 9.26KK41 pKa = 10.65LSAA44 pKa = 3.91
MM1 pKa = 7.35KK2 pKa = 9.43RR3 pKa = 11.84TYY5 pKa = 10.27QPSKK9 pKa = 9.43LVRR12 pKa = 11.84ARR14 pKa = 11.84RR15 pKa = 11.84HH16 pKa = 4.38GFRR19 pKa = 11.84ARR21 pKa = 11.84MATVGGRR28 pKa = 11.84NVIRR32 pKa = 11.84NRR34 pKa = 11.84RR35 pKa = 11.84AQGRR39 pKa = 11.84KK40 pKa = 9.26KK41 pKa = 10.65LSAA44 pKa = 3.91
Molecular weight: 5.14 kDa
Isoelectric point according different methods:
Peptides (in silico digests for buttom-up proteomics)
Below you can find in silico digests of the whole proteome with Trypsin, Chymotrypsin, Trypsin+LysC, LysN, ArgC proteases suitable for different mass spec machines.| Try ESI |
 |
|---|
| ChTry ESI |
|
|---|
| ArgC ESI |
|
|---|
| LysN ESI |
|
|---|
| TryLysC ESI |
|
|---|
| Try MALDI |
|
|---|
| ChTry MALDI |
|
|---|
| ArgC MALDI |
|
|---|
| LysN MALDI |
|
|---|
| TryLysC MALDI |
|
|---|
| Try LTQ |
|
|---|
| ChTry LTQ |
|
|---|
| ArgC LTQ |
|
|---|
| LysN LTQ |
|
|---|
| TryLysC LTQ |
|
|---|
| Try MSlow |
|
|---|
| ChTry MSlow |
|
|---|
| ArgC MSlow |
|
|---|
| LysN MSlow |
|
|---|
| TryLysC MSlow |
|
|---|
| Try MShigh |
|
|---|
| ChTry MShigh |
|
|---|
| ArgC MShigh |
|
|---|
| LysN MShigh |
|
|---|
| TryLysC MShigh |
|
|---|
General Statistics
Number of major isoforms |
Number of additional isoforms |
Number of all proteins |
Number of amino acids |
Min. Seq. Length |
Max. Seq. Length |
Avg. Seq. Length |
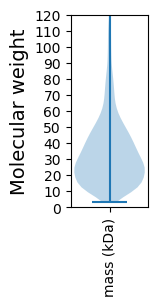
Avg. Mol. Weight |
|---|---|---|---|---|---|---|---|
0 |
1023288 |
29 |
2830 |
330.0 |
35.22 |
Amino acid frequency
Ala |
Cys |
Asp |
Glu |
Phe |
Gly |
His |
Ile |
Lys |
Leu |
|---|---|---|---|---|---|---|---|---|---|
14.897 ± 0.066 | 0.721 ± 0.012 |
6.021 ± 0.033 | 4.334 ± 0.04 |
3.496 ± 0.024 | 9.234 ± 0.062 |
1.896 ± 0.023 | 4.835 ± 0.025 |
2.514 ± 0.038 | 9.876 ± 0.049 |
Met |
Asn |
Gln |
Pro |
Arg |
Ser |
Thr |
Val |
Trp |
Tyr |
|---|---|---|---|---|---|---|---|---|---|
2.329 ± 0.023 | 2.456 ± 0.031 |
5.628 ± 0.039 | 2.842 ± 0.023 |
7.341 ± 0.043 | 4.816 ± 0.036 |
5.619 ± 0.036 | 7.652 ± 0.03 |
1.439 ± 0.019 | 2.054 ± 0.02 |
Most of the basic statistics you can see at this page can be downloaded from this CSV file
See this proteome in:

Proteome-pI is available under Creative Commons Attribution-NoDerivs license, for more details see here
| Reference: Kozlowski LP. Proteome-pI 2.0: Proteome Isoelectric Point Database Update. Nucleic Acids Res. 2021, doi: 10.1093/nar/gkab944 | Contact: Lukasz P. Kozlowski |