Faecalibacterium sp. CAG:74
Taxonomy: cellular organisms; Bacteria; Terrabacteria group; Firmicutes; Clostridia; Eubacteriales; Oscillospiraceae; Faecalibacterium; environmental samples
Average proteome isoelectric point is 6.13
Get precalculated fractions of proteins

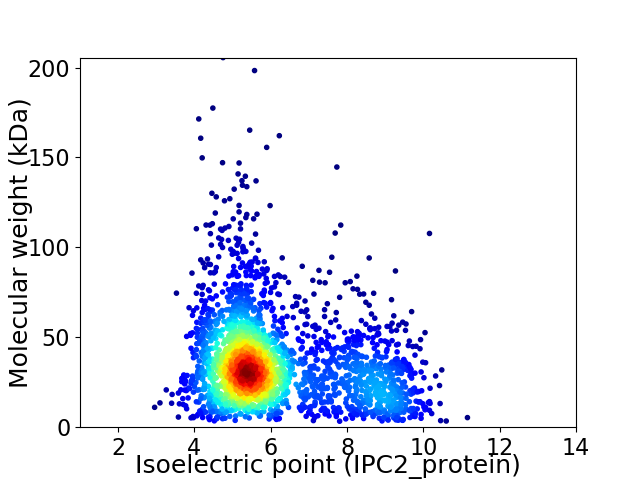
Virtual 2D-PAGE plot for 2464 proteins (isoelectric point calculated using IPC2_protein)
Get csv file with sequences according to given criteria:
* You can choose from 21 different methods for calculating isoelectric point
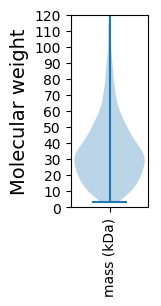
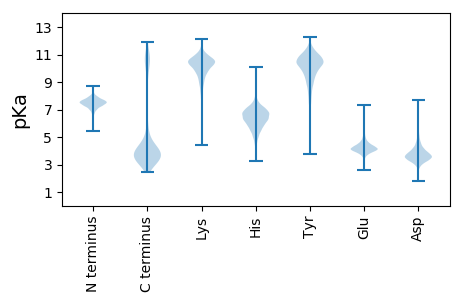
Summary statistics related to proteome-wise predictions


Protein with the lowest isoelectric point:
>tr|R7I4K8|R7I4K8_9FIRM Bacterial SH3 domain protein OS=Faecalibacterium sp. CAG:74 OX=1262897 GN=BN770_00947 PE=4 SV=1
MM1 pKa = 7.59KK2 pKa = 10.47KK3 pKa = 10.36FFSLFLAVLLIFSCWTAATAEE24 pKa = 4.32STDD27 pKa = 3.78AVSGAPLDD35 pKa = 3.73NDD37 pKa = 3.28IEE39 pKa = 4.42IVYY42 pKa = 10.21KK43 pKa = 10.12EE44 pKa = 4.76HH45 pKa = 7.01FDD47 pKa = 4.82DD48 pKa = 4.03MVTRR52 pKa = 11.84YY53 pKa = 10.27ADD55 pKa = 3.54EE56 pKa = 4.08LTEE59 pKa = 5.13AEE61 pKa = 4.75LLVSADD67 pKa = 3.52VYY69 pKa = 11.32DD70 pKa = 5.05AIGMIRR76 pKa = 11.84FDD78 pKa = 5.11SEE80 pKa = 4.05DD81 pKa = 3.25SLAARR86 pKa = 11.84QRR88 pKa = 11.84IYY90 pKa = 11.26GIASADD96 pKa = 3.75DD97 pKa = 3.36LHH99 pKa = 7.76AILTGYY105 pKa = 10.34FDD107 pKa = 5.55PNDD110 pKa = 3.54AAYY113 pKa = 8.5TADD116 pKa = 3.56AALDD120 pKa = 3.67ARR122 pKa = 11.84LQAILAACGLNPEE135 pKa = 5.24DD136 pKa = 4.38YY137 pKa = 10.43DD138 pKa = 3.83ISVIRR143 pKa = 11.84NLSGMPEE150 pKa = 5.19PITGTNWYY158 pKa = 7.34CTLIRR163 pKa = 11.84KK164 pKa = 9.26GIEE167 pKa = 3.85VAEE170 pKa = 4.91DD171 pKa = 3.19EE172 pKa = 4.62TNPYY176 pKa = 11.47DD177 pKa = 3.85MVIVLYY183 pKa = 10.38GDD185 pKa = 3.66EE186 pKa = 4.24MTVGAFVLNPEE197 pKa = 4.23VV198 pKa = 3.3
MM1 pKa = 7.59KK2 pKa = 10.47KK3 pKa = 10.36FFSLFLAVLLIFSCWTAATAEE24 pKa = 4.32STDD27 pKa = 3.78AVSGAPLDD35 pKa = 3.73NDD37 pKa = 3.28IEE39 pKa = 4.42IVYY42 pKa = 10.21KK43 pKa = 10.12EE44 pKa = 4.76HH45 pKa = 7.01FDD47 pKa = 4.82DD48 pKa = 4.03MVTRR52 pKa = 11.84YY53 pKa = 10.27ADD55 pKa = 3.54EE56 pKa = 4.08LTEE59 pKa = 5.13AEE61 pKa = 4.75LLVSADD67 pKa = 3.52VYY69 pKa = 11.32DD70 pKa = 5.05AIGMIRR76 pKa = 11.84FDD78 pKa = 5.11SEE80 pKa = 4.05DD81 pKa = 3.25SLAARR86 pKa = 11.84QRR88 pKa = 11.84IYY90 pKa = 11.26GIASADD96 pKa = 3.75DD97 pKa = 3.36LHH99 pKa = 7.76AILTGYY105 pKa = 10.34FDD107 pKa = 5.55PNDD110 pKa = 3.54AAYY113 pKa = 8.5TADD116 pKa = 3.56AALDD120 pKa = 3.67ARR122 pKa = 11.84LQAILAACGLNPEE135 pKa = 5.24DD136 pKa = 4.38YY137 pKa = 10.43DD138 pKa = 3.83ISVIRR143 pKa = 11.84NLSGMPEE150 pKa = 5.19PITGTNWYY158 pKa = 7.34CTLIRR163 pKa = 11.84KK164 pKa = 9.26GIEE167 pKa = 3.85VAEE170 pKa = 4.91DD171 pKa = 3.19EE172 pKa = 4.62TNPYY176 pKa = 11.47DD177 pKa = 3.85MVIVLYY183 pKa = 10.38GDD185 pKa = 3.66EE186 pKa = 4.24MTVGAFVLNPEE197 pKa = 4.23VV198 pKa = 3.3
Molecular weight: 21.77 kDa
Isoelectric point according different methods:
Protein with the highest isoelectric point:
>tr|R7I6M8|R7I6M8_9FIRM Ribonuclease P protein component OS=Faecalibacterium sp. CAG:74 OX=1262897 GN=rnpA PE=3 SV=1
MM1 pKa = 7.25FRR3 pKa = 11.84TYY5 pKa = 9.97QPKK8 pKa = 9.54KK9 pKa = 7.56RR10 pKa = 11.84QRR12 pKa = 11.84SKK14 pKa = 9.17VHH16 pKa = 5.87GFRR19 pKa = 11.84ARR21 pKa = 11.84MATKK25 pKa = 9.78NGRR28 pKa = 11.84RR29 pKa = 11.84VLSARR34 pKa = 11.84RR35 pKa = 11.84RR36 pKa = 11.84RR37 pKa = 11.84GRR39 pKa = 11.84KK40 pKa = 9.14SLTVV44 pKa = 3.2
MM1 pKa = 7.25FRR3 pKa = 11.84TYY5 pKa = 9.97QPKK8 pKa = 9.54KK9 pKa = 7.56RR10 pKa = 11.84QRR12 pKa = 11.84SKK14 pKa = 9.17VHH16 pKa = 5.87GFRR19 pKa = 11.84ARR21 pKa = 11.84MATKK25 pKa = 9.78NGRR28 pKa = 11.84RR29 pKa = 11.84VLSARR34 pKa = 11.84RR35 pKa = 11.84RR36 pKa = 11.84RR37 pKa = 11.84GRR39 pKa = 11.84KK40 pKa = 9.14SLTVV44 pKa = 3.2
Molecular weight: 5.33 kDa
Isoelectric point according different methods:
Peptides (in silico digests for buttom-up proteomics)
Below you can find in silico digests of the whole proteome with Trypsin, Chymotrypsin, Trypsin+LysC, LysN, ArgC proteases suitable for different mass spec machines.| Try ESI |
 |
|---|
| ChTry ESI |
 |
|---|
| ArgC ESI |
 |
|---|
| LysN ESI |
 |
|---|
| TryLysC ESI |
 |
|---|
| Try MALDI |
 |
|---|
| ChTry MALDI |
 |
|---|
| ArgC MALDI |
 |
|---|
| LysN MALDI |
 |
|---|
| TryLysC MALDI |
 |
|---|
| Try LTQ |
 |
|---|
| ChTry LTQ |
 |
|---|
| ArgC LTQ |
 |
|---|
| LysN LTQ |
 |
|---|
| TryLysC LTQ |
 |
|---|
| Try MSlow |
 |
|---|
| ChTry MSlow |
 |
|---|
| ArgC MSlow |
 |
|---|
| LysN MSlow |
 |
|---|
| TryLysC MSlow |
 |
|---|
| Try MShigh |
 |
|---|
| ChTry MShigh |
 |
|---|
| ArgC MShigh |
 |
|---|
| LysN MShigh |
 |
|---|
| TryLysC MShigh |
 |
|---|
General Statistics
Number of major isoforms |
Number of additional isoforms |
Number of all proteins |
Number of amino acids |
Min. Seq. Length |
Max. Seq. Length |
Avg. Seq. Length |
Avg. Mol. Weight |
|---|---|---|---|---|---|---|---|
0 |
819612 |
29 |
1818 |
332.6 |
36.84 |
Amino acid frequency
Ala |
Cys |
Asp |
Glu |
Phe |
Gly |
His |
Ile |
Lys |
Leu |
|---|---|---|---|---|---|---|---|---|---|
9.779 ± 0.06 | 1.606 ± 0.021 |
5.818 ± 0.04 | 6.231 ± 0.051 |
3.626 ± 0.027 | 7.322 ± 0.043 |
2.04 ± 0.026 | 5.523 ± 0.038 |
4.491 ± 0.044 | 9.915 ± 0.057 |
Met |
Asn |
Gln |
Pro |
Arg |
Ser |
Thr |
Val |
Trp |
Tyr |
|---|---|---|---|---|---|---|---|---|---|
3.292 ± 0.026 | 3.547 ± 0.03 |
4.24 ± 0.035 | 3.727 ± 0.033 |
5.613 ± 0.05 | 5.331 ± 0.038 |
6.021 ± 0.047 | 7.193 ± 0.045 |
1.173 ± 0.022 | 3.512 ± 0.034 |
Most of the basic statistics you can see at this page can be downloaded from this CSV file
Proteome-pI is available under Creative Commons Attribution-NoDerivs license, for more details see here
| Reference: Kozlowski LP. Proteome-pI 2.0: Proteome Isoelectric Point Database Update. Nucleic Acids Res. 2021, doi: 10.1093/nar/gkab944 | Contact: Lukasz P. Kozlowski |
