Thermosyntropha lipolytica DSM 11003
Taxonomy: cellular organisms; Bacteria; Terrabacteria group; Firmicutes; Clostridia; Eubacteriales; Syntrophomonadaceae; Thermosyntropha; Thermosyntropha lipolytica
Average proteome isoelectric point is 6.46
Get precalculated fractions of proteins

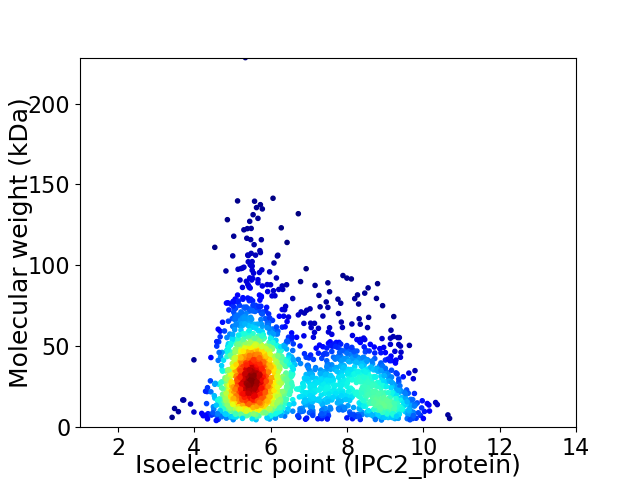
Virtual 2D-PAGE plot for 2141 proteins (isoelectric point calculated using IPC2_protein)
Get csv file with sequences according to given criteria:
* You can choose from 21 different methods for calculating isoelectric point
Summary statistics related to proteome-wise predictions


Protein with the lowest isoelectric point:
>tr|A0A1M5MVR3|A0A1M5MVR3_9FIRM Uncharacterized protein OS=Thermosyntropha lipolytica DSM 11003 OX=1123382 GN=SAMN02745221_01037 PE=4 SV=1
MM1 pKa = 7.45RR2 pKa = 11.84VEE4 pKa = 4.62KK5 pKa = 10.81GLLYY9 pKa = 10.45TEE11 pKa = 3.72NHH13 pKa = 5.51EE14 pKa = 4.22WLKK17 pKa = 11.14VEE19 pKa = 4.38GDD21 pKa = 3.2KK22 pKa = 11.12AYY24 pKa = 9.91IGITDD29 pKa = 3.69YY30 pKa = 11.44AQEE33 pKa = 4.1HH34 pKa = 6.63LGDD37 pKa = 3.53IVFVEE42 pKa = 4.5LPEE45 pKa = 4.43VDD47 pKa = 4.49AEE49 pKa = 4.04FDD51 pKa = 3.57ADD53 pKa = 3.56EE54 pKa = 5.23GIAVIEE60 pKa = 4.26SVKK63 pKa = 10.61AVSSVYY69 pKa = 10.4TPVACTILEE78 pKa = 4.25VNEE81 pKa = 4.14EE82 pKa = 4.24LEE84 pKa = 4.48GAPEE88 pKa = 4.56LLNEE92 pKa = 4.29DD93 pKa = 5.43CYY95 pKa = 11.88ANWIALISIKK105 pKa = 11.08DD106 pKa = 3.41MDD108 pKa = 4.67GLNKK112 pKa = 10.5LMDD115 pKa = 4.22AEE117 pKa = 4.53AYY119 pKa = 8.49EE120 pKa = 4.32AFCAEE125 pKa = 4.15QEE127 pKa = 4.32EE128 pKa = 4.64
MM1 pKa = 7.45RR2 pKa = 11.84VEE4 pKa = 4.62KK5 pKa = 10.81GLLYY9 pKa = 10.45TEE11 pKa = 3.72NHH13 pKa = 5.51EE14 pKa = 4.22WLKK17 pKa = 11.14VEE19 pKa = 4.38GDD21 pKa = 3.2KK22 pKa = 11.12AYY24 pKa = 9.91IGITDD29 pKa = 3.69YY30 pKa = 11.44AQEE33 pKa = 4.1HH34 pKa = 6.63LGDD37 pKa = 3.53IVFVEE42 pKa = 4.5LPEE45 pKa = 4.43VDD47 pKa = 4.49AEE49 pKa = 4.04FDD51 pKa = 3.57ADD53 pKa = 3.56EE54 pKa = 5.23GIAVIEE60 pKa = 4.26SVKK63 pKa = 10.61AVSSVYY69 pKa = 10.4TPVACTILEE78 pKa = 4.25VNEE81 pKa = 4.14EE82 pKa = 4.24LEE84 pKa = 4.48GAPEE88 pKa = 4.56LLNEE92 pKa = 4.29DD93 pKa = 5.43CYY95 pKa = 11.88ANWIALISIKK105 pKa = 11.08DD106 pKa = 3.41MDD108 pKa = 4.67GLNKK112 pKa = 10.5LMDD115 pKa = 4.22AEE117 pKa = 4.53AYY119 pKa = 8.49EE120 pKa = 4.32AFCAEE125 pKa = 4.15QEE127 pKa = 4.32EE128 pKa = 4.64
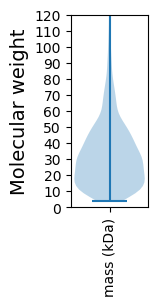
Molecular weight: 14.31 kDa
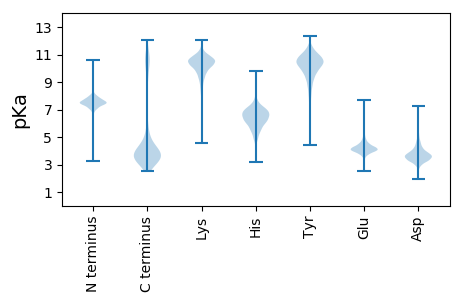
Isoelectric point according different methods:
Protein with the highest isoelectric point:
>tr|A0A1M5S4X8|A0A1M5S4X8_9FIRM Transposase OS=Thermosyntropha lipolytica DSM 11003 OX=1123382 GN=SAMN02745221_02168 PE=4 SV=1
MM1 pKa = 7.65DD2 pKa = 3.59QYY4 pKa = 11.78HH5 pKa = 7.71LIRR8 pKa = 11.84HH9 pKa = 6.43LYY11 pKa = 9.15LVEE14 pKa = 4.33GMSQRR19 pKa = 11.84AIAKK23 pKa = 9.45QLGISRR29 pKa = 11.84NTVRR33 pKa = 11.84RR34 pKa = 11.84YY35 pKa = 10.26CKK37 pKa = 10.44GEE39 pKa = 3.72QVPWEE44 pKa = 4.1RR45 pKa = 11.84KK46 pKa = 6.67PVKK49 pKa = 9.81RR50 pKa = 11.84APSVITPGEE59 pKa = 4.1ALSLLPTWSSRR70 pKa = 11.84VGQKK74 pKa = 8.85SFRR77 pKa = 11.84ILCC80 pKa = 4.12
MM1 pKa = 7.65DD2 pKa = 3.59QYY4 pKa = 11.78HH5 pKa = 7.71LIRR8 pKa = 11.84HH9 pKa = 6.43LYY11 pKa = 9.15LVEE14 pKa = 4.33GMSQRR19 pKa = 11.84AIAKK23 pKa = 9.45QLGISRR29 pKa = 11.84NTVRR33 pKa = 11.84RR34 pKa = 11.84YY35 pKa = 10.26CKK37 pKa = 10.44GEE39 pKa = 3.72QVPWEE44 pKa = 4.1RR45 pKa = 11.84KK46 pKa = 6.67PVKK49 pKa = 9.81RR50 pKa = 11.84APSVITPGEE59 pKa = 4.1ALSLLPTWSSRR70 pKa = 11.84VGQKK74 pKa = 8.85SFRR77 pKa = 11.84ILCC80 pKa = 4.12
Molecular weight: 9.24 kDa
Isoelectric point according different methods:
Peptides (in silico digests for buttom-up proteomics)
Below you can find in silico digests of the whole proteome with Trypsin, Chymotrypsin, Trypsin+LysC, LysN, ArgC proteases suitable for different mass spec machines.| Try ESI |
 |
|---|
| ChTry ESI |
 |
|---|
| ArgC ESI |
 |
|---|
| LysN ESI |
 |
|---|
| TryLysC ESI |
 |
|---|
| Try MALDI |
 |
|---|
| ChTry MALDI |
 |
|---|
| ArgC MALDI |
 |
|---|
| LysN MALDI |
 |
|---|
| TryLysC MALDI |
 |
|---|
| Try LTQ |
 |
|---|
| ChTry LTQ |
 |
|---|
| ArgC LTQ |
 |
|---|
| LysN LTQ |
 |
|---|
| TryLysC LTQ |
 |
|---|
| Try MSlow |
 |
|---|
| ChTry MSlow |
 |
|---|
| ArgC MSlow |
 |
|---|
| LysN MSlow |
 |
|---|
| TryLysC MSlow |
 |
|---|
| Try MShigh |
 |
|---|
| ChTry MShigh |
 |
|---|
| ArgC MShigh |
 |
|---|
| LysN MShigh |
 |
|---|
| TryLysC MShigh |
 |
|---|
General Statistics
Number of major isoforms |
Number of additional isoforms |
Number of all proteins |
Number of amino acids |
Min. Seq. Length |
Max. Seq. Length |
Avg. Seq. Length |
Avg. Mol. Weight |
|---|---|---|---|---|---|---|---|
0 |
645175 |
39 |
2074 |
301.3 |
33.85 |
Amino acid frequency
Ala |
Cys |
Asp |
Glu |
Phe |
Gly |
His |
Ile |
Lys |
Leu |
|---|---|---|---|---|---|---|---|---|---|
7.818 ± 0.057 | 1.095 ± 0.024 |
5.008 ± 0.04 | 8.191 ± 0.068 |
4.048 ± 0.039 | 7.315 ± 0.045 |
1.628 ± 0.023 | 8.163 ± 0.04 |
7.277 ± 0.05 | 10.01 ± 0.063 |
Met |
Asn |
Gln |
Pro |
Arg |
Ser |
Thr |
Val |
Trp |
Tyr |
|---|---|---|---|---|---|---|---|---|---|
2.692 ± 0.023 | 3.939 ± 0.034 |
3.839 ± 0.033 | 2.802 ± 0.027 |
5.159 ± 0.043 | 4.846 ± 0.034 |
4.31 ± 0.032 | 7.118 ± 0.043 |
0.945 ± 0.018 | 3.797 ± 0.033 |
Most of the basic statistics you can see at this page can be downloaded from this CSV file
Proteome-pI is available under Creative Commons Attribution-NoDerivs license, for more details see here
| Reference: Kozlowski LP. Proteome-pI 2.0: Proteome Isoelectric Point Database Update. Nucleic Acids Res. 2021, doi: 10.1093/nar/gkab944 | Contact: Lukasz P. Kozlowski |
