Vibrio diazotrophicus
Taxonomy: cellular organisms; Bacteria; Proteobacteria;
Average proteome isoelectric point is 6.09
Get precalculated fractions of proteins

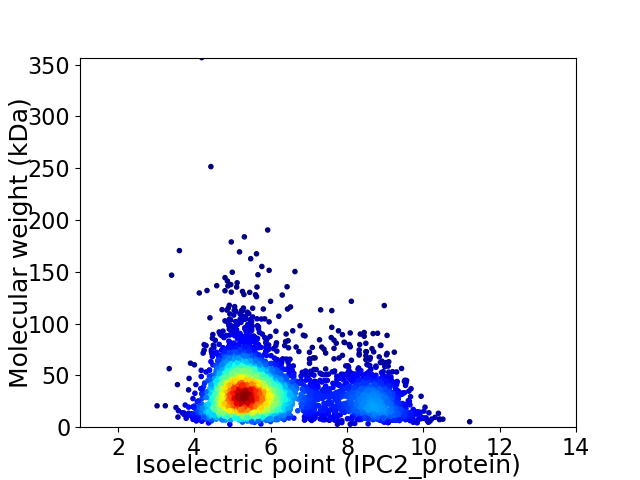
Virtual 2D-PAGE plot for 4064 proteins (isoelectric point calculated using IPC2_protein)
Get csv file with sequences according to given criteria:
* You can choose from 21 different methods for calculating isoelectric point
Summary statistics related to proteome-wise predictions


Protein with the lowest isoelectric point:
>tr|A0A2J8GUC2|A0A2J8GUC2_VIBDI Methyl-accepting chemotaxis protein OS=Vibrio diazotrophicus OX=685 GN=C1M56_06225 PE=4 SV=1
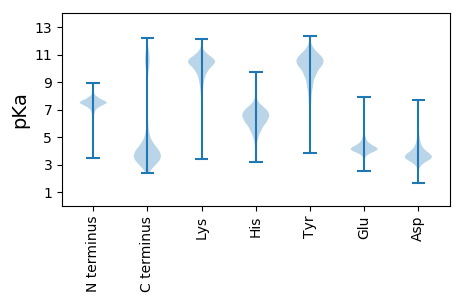
MM1 pKa = 7.65KK2 pKa = 9.08KK3 pKa = 8.28TLLALAVLAAAGSAQAGIEE22 pKa = 3.97IYY24 pKa = 10.69NNEE27 pKa = 3.99GVTVNLKK34 pKa = 10.5GDD36 pKa = 3.61IEE38 pKa = 4.05ITYY41 pKa = 10.62QNSTDD46 pKa = 3.8SASMSQQIEE55 pKa = 4.04DD56 pKa = 3.71ADD58 pKa = 3.96FGFDD62 pKa = 3.78VRR64 pKa = 11.84YY65 pKa = 10.73AMNDD69 pKa = 3.21QVSIGAYY76 pKa = 8.96WEE78 pKa = 4.53FNGSDD83 pKa = 3.64TNNATVTKK91 pKa = 10.91NGDD94 pKa = 3.48NYY96 pKa = 10.21VALYY100 pKa = 8.89TADD103 pKa = 3.45FGSIKK108 pKa = 10.38FGRR111 pKa = 11.84LCTAIDD117 pKa = 4.97DD118 pKa = 3.91IGIGNDD124 pKa = 3.29YY125 pKa = 11.01QFGINSFFDD134 pKa = 3.51KK135 pKa = 10.27KK136 pKa = 9.4TFEE139 pKa = 4.54CQDD142 pKa = 2.94EE143 pKa = 4.35AVRR146 pKa = 11.84YY147 pKa = 10.0DD148 pKa = 3.68YY149 pKa = 11.67DD150 pKa = 3.32NGMFYY155 pKa = 10.31ATLGYY160 pKa = 9.45VQNKK164 pKa = 9.67LNDD167 pKa = 3.15GSTDD171 pKa = 3.52YY172 pKa = 10.36TAGGAEE178 pKa = 5.16DD179 pKa = 3.27IAANQGSDD187 pKa = 2.93ADD189 pKa = 4.37YY190 pKa = 10.65IDD192 pKa = 5.03GYY194 pKa = 10.8VGARR198 pKa = 11.84FAGFDD203 pKa = 3.63AKK205 pKa = 10.96VILADD210 pKa = 3.74YY211 pKa = 11.11DD212 pKa = 3.95SDD214 pKa = 4.1NDD216 pKa = 3.9AAPLSSSLLGLEE228 pKa = 4.09VAYY231 pKa = 10.53GGVEE235 pKa = 3.93NLNLSVGYY243 pKa = 9.96YY244 pKa = 10.33SADD247 pKa = 3.31KK248 pKa = 11.34DD249 pKa = 3.72EE250 pKa = 5.63AGTNKK255 pKa = 10.69DD256 pKa = 2.98NDD258 pKa = 3.75TWALAADD265 pKa = 3.74YY266 pKa = 9.27TIGKK270 pKa = 8.73VVVGAGYY277 pKa = 9.79SQTEE281 pKa = 3.95FDD283 pKa = 5.33ASDD286 pKa = 3.61KK287 pKa = 10.63EE288 pKa = 4.25QTNSFVNVAYY298 pKa = 9.73KK299 pKa = 10.24VLPAVKK305 pKa = 10.23VYY307 pKa = 11.38GEE309 pKa = 4.01VAKK312 pKa = 10.52RR313 pKa = 11.84DD314 pKa = 3.61LSGTGVTAFEE324 pKa = 4.44NEE326 pKa = 3.42NLAAVGVTASFF337 pKa = 3.6
MM1 pKa = 7.65KK2 pKa = 9.08KK3 pKa = 8.28TLLALAVLAAAGSAQAGIEE22 pKa = 3.97IYY24 pKa = 10.69NNEE27 pKa = 3.99GVTVNLKK34 pKa = 10.5GDD36 pKa = 3.61IEE38 pKa = 4.05ITYY41 pKa = 10.62QNSTDD46 pKa = 3.8SASMSQQIEE55 pKa = 4.04DD56 pKa = 3.71ADD58 pKa = 3.96FGFDD62 pKa = 3.78VRR64 pKa = 11.84YY65 pKa = 10.73AMNDD69 pKa = 3.21QVSIGAYY76 pKa = 8.96WEE78 pKa = 4.53FNGSDD83 pKa = 3.64TNNATVTKK91 pKa = 10.91NGDD94 pKa = 3.48NYY96 pKa = 10.21VALYY100 pKa = 8.89TADD103 pKa = 3.45FGSIKK108 pKa = 10.38FGRR111 pKa = 11.84LCTAIDD117 pKa = 4.97DD118 pKa = 3.91IGIGNDD124 pKa = 3.29YY125 pKa = 11.01QFGINSFFDD134 pKa = 3.51KK135 pKa = 10.27KK136 pKa = 9.4TFEE139 pKa = 4.54CQDD142 pKa = 2.94EE143 pKa = 4.35AVRR146 pKa = 11.84YY147 pKa = 10.0DD148 pKa = 3.68YY149 pKa = 11.67DD150 pKa = 3.32NGMFYY155 pKa = 10.31ATLGYY160 pKa = 9.45VQNKK164 pKa = 9.67LNDD167 pKa = 3.15GSTDD171 pKa = 3.52YY172 pKa = 10.36TAGGAEE178 pKa = 5.16DD179 pKa = 3.27IAANQGSDD187 pKa = 2.93ADD189 pKa = 4.37YY190 pKa = 10.65IDD192 pKa = 5.03GYY194 pKa = 10.8VGARR198 pKa = 11.84FAGFDD203 pKa = 3.63AKK205 pKa = 10.96VILADD210 pKa = 3.74YY211 pKa = 11.11DD212 pKa = 3.95SDD214 pKa = 4.1NDD216 pKa = 3.9AAPLSSSLLGLEE228 pKa = 4.09VAYY231 pKa = 10.53GGVEE235 pKa = 3.93NLNLSVGYY243 pKa = 9.96YY244 pKa = 10.33SADD247 pKa = 3.31KK248 pKa = 11.34DD249 pKa = 3.72EE250 pKa = 5.63AGTNKK255 pKa = 10.69DD256 pKa = 2.98NDD258 pKa = 3.75TWALAADD265 pKa = 3.74YY266 pKa = 9.27TIGKK270 pKa = 8.73VVVGAGYY277 pKa = 9.79SQTEE281 pKa = 3.95FDD283 pKa = 5.33ASDD286 pKa = 3.61KK287 pKa = 10.63EE288 pKa = 4.25QTNSFVNVAYY298 pKa = 9.73KK299 pKa = 10.24VLPAVKK305 pKa = 10.23VYY307 pKa = 11.38GEE309 pKa = 4.01VAKK312 pKa = 10.52RR313 pKa = 11.84DD314 pKa = 3.61LSGTGVTAFEE324 pKa = 4.44NEE326 pKa = 3.42NLAAVGVTASFF337 pKa = 3.6
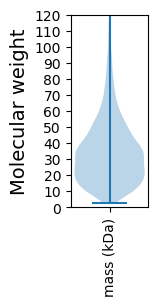
Molecular weight: 36.02 kDa
Isoelectric point according different methods:
Protein with the highest isoelectric point:
>tr|A0A2J8I7P1|A0A2J8I7P1_VIBDI Nitrogen fixation protein NifT OS=Vibrio diazotrophicus OX=685 GN=nifT PE=4 SV=1
MM1 pKa = 7.69SKK3 pKa = 8.99RR4 pKa = 11.84TFQPTVLKK12 pKa = 10.46RR13 pKa = 11.84KK14 pKa = 7.65RR15 pKa = 11.84THH17 pKa = 5.89GFRR20 pKa = 11.84ARR22 pKa = 11.84MATANGRR29 pKa = 11.84KK30 pKa = 9.34VINARR35 pKa = 11.84RR36 pKa = 11.84AKK38 pKa = 9.74GRR40 pKa = 11.84KK41 pKa = 8.91RR42 pKa = 11.84LSKK45 pKa = 10.84
MM1 pKa = 7.69SKK3 pKa = 8.99RR4 pKa = 11.84TFQPTVLKK12 pKa = 10.46RR13 pKa = 11.84KK14 pKa = 7.65RR15 pKa = 11.84THH17 pKa = 5.89GFRR20 pKa = 11.84ARR22 pKa = 11.84MATANGRR29 pKa = 11.84KK30 pKa = 9.34VINARR35 pKa = 11.84RR36 pKa = 11.84AKK38 pKa = 9.74GRR40 pKa = 11.84KK41 pKa = 8.91RR42 pKa = 11.84LSKK45 pKa = 10.84
Molecular weight: 5.27 kDa
Isoelectric point according different methods:
Peptides (in silico digests for buttom-up proteomics)
Below you can find in silico digests of the whole proteome with Trypsin, Chymotrypsin, Trypsin+LysC, LysN, ArgC proteases suitable for different mass spec machines.| Try ESI |
 |
|---|
| ChTry ESI |
 |
|---|
| ArgC ESI |
 |
|---|
| LysN ESI |
 |
|---|
| TryLysC ESI |
 |
|---|
| Try MALDI |
 |
|---|
| ChTry MALDI |
 |
|---|
| ArgC MALDI |
 |
|---|
| LysN MALDI |
 |
|---|
| TryLysC MALDI |
 |
|---|
| Try LTQ |
 |
|---|
| ChTry LTQ |
 |
|---|
| ArgC LTQ |
 |
|---|
| LysN LTQ |
 |
|---|
| TryLysC LTQ |
 |
|---|
| Try MSlow |
 |
|---|
| ChTry MSlow |
 |
|---|
| ArgC MSlow |
 |
|---|
| LysN MSlow |
 |
|---|
| TryLysC MSlow |
 |
|---|
| Try MShigh |
 |
|---|
| ChTry MShigh |
 |
|---|
| ArgC MShigh |
 |
|---|
| LysN MShigh |
 |
|---|
| TryLysC MShigh |
 |
|---|
General Statistics
Number of major isoforms |
Number of additional isoforms |
Number of all proteins |
Number of amino acids |
Min. Seq. Length |
Max. Seq. Length |
Avg. Seq. Length |
Avg. Mol. Weight |
|---|---|---|---|---|---|---|---|
0 |
1322842 |
24 |
3331 |
325.5 |
36.21 |
Amino acid frequency
Ala |
Cys |
Asp |
Glu |
Phe |
Gly |
His |
Ile |
Lys |
Leu |
|---|---|---|---|---|---|---|---|---|---|
8.478 ± 0.039 | 1.039 ± 0.014 |
5.366 ± 0.031 | 6.456 ± 0.041 |
4.112 ± 0.028 | 6.726 ± 0.033 |
2.249 ± 0.018 | 6.446 ± 0.031 |
5.432 ± 0.031 | 10.327 ± 0.045 |
Met |
Asn |
Gln |
Pro |
Arg |
Ser |
Thr |
Val |
Trp |
Tyr |
|---|---|---|---|---|---|---|---|---|---|
2.713 ± 0.019 | 4.285 ± 0.027 |
3.821 ± 0.027 | 4.523 ± 0.031 |
4.478 ± 0.033 | 6.753 ± 0.038 |
5.278 ± 0.032 | 7.176 ± 0.034 |
1.264 ± 0.018 | 3.075 ± 0.023 |
Most of the basic statistics you can see at this page can be downloaded from this CSV file
Proteome-pI is available under Creative Commons Attribution-NoDerivs license, for more details see here
| Reference: Kozlowski LP. Proteome-pI 2.0: Proteome Isoelectric Point Database Update. Nucleic Acids Res. 2021, doi: 10.1093/nar/gkab944 | Contact: Lukasz P. Kozlowski |
