Ferrimicrobium acidiphilum DSM 19497
Taxonomy: cellular organisms; Bacteria; Terrabacteria group; Actinobacteria; Acidimicrobiia; Acidimicrobiales; Acidimicrobiaceae; Ferrimicrobium; Ferrimicrobium acidiphilum
Average proteome isoelectric point is 6.46
Get precalculated fractions of proteins

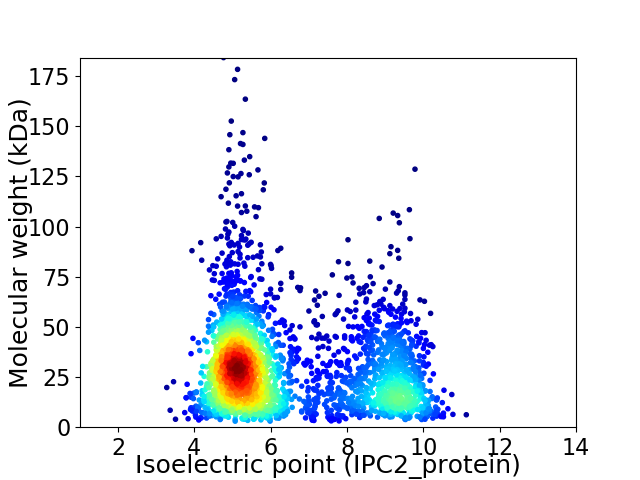
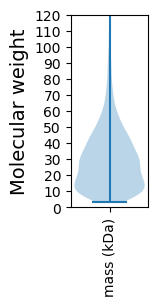
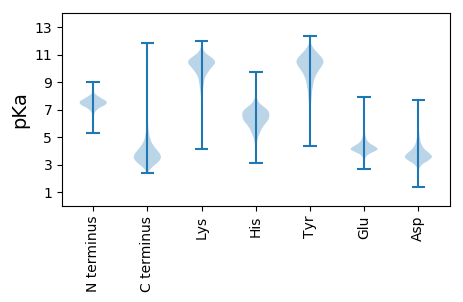
Virtual 2D-PAGE plot for 2974 proteins (isoelectric point calculated using IPC2_protein)
Get csv file with sequences according to given criteria:
* You can choose from 21 different methods for calculating isoelectric point
Summary statistics related to proteome-wise predictions


Protein with the lowest isoelectric point:
>tr|A0A0D8FRF9|A0A0D8FRF9_9ACTN Uncharacterized protein OS=Ferrimicrobium acidiphilum DSM 19497 OX=1121877 GN=FEAC_25480 PE=4 SV=1
MM1 pKa = 7.68SDD3 pKa = 3.51FRR5 pKa = 11.84VTDD8 pKa = 3.38VAVEE12 pKa = 4.31VVLEE16 pKa = 3.9ALADD20 pKa = 3.92EE21 pKa = 5.04GQTDD25 pKa = 5.07ALALWIEE32 pKa = 4.22VAGNDD37 pKa = 4.35GASFMYY43 pKa = 10.1DD44 pKa = 2.88VYY46 pKa = 10.91FQEE49 pKa = 5.35LAQADD54 pKa = 4.29PDD56 pKa = 4.19DD57 pKa = 4.0LHH59 pKa = 8.71LHH61 pKa = 6.09FGEE64 pKa = 4.49LNVVIPKK71 pKa = 9.67TSIAQLNGATLEE83 pKa = 4.2VGGDD87 pKa = 3.65GEE89 pKa = 5.11LAITNPNTPTPEE101 pKa = 4.68ASDD104 pKa = 4.54LPDD107 pKa = 4.89LGPEE111 pKa = 3.85ALANDD116 pKa = 3.95LALRR120 pKa = 11.84VNAILEE126 pKa = 4.35EE127 pKa = 4.18QVNPAIAAHH136 pKa = 6.43GGYY139 pKa = 10.41AEE141 pKa = 4.34LVGVVDD147 pKa = 4.04ARR149 pKa = 11.84AYY151 pKa = 10.26VLMGGGCQGCGLAAMTLSQGIATAIQEE178 pKa = 4.47AVPEE182 pKa = 4.1IVDD185 pKa = 3.36IVDD188 pKa = 3.8VTNHH192 pKa = 6.18AAGNNPYY199 pKa = 9.62YY200 pKa = 10.65QPAKK204 pKa = 10.23KK205 pKa = 10.29
MM1 pKa = 7.68SDD3 pKa = 3.51FRR5 pKa = 11.84VTDD8 pKa = 3.38VAVEE12 pKa = 4.31VVLEE16 pKa = 3.9ALADD20 pKa = 3.92EE21 pKa = 5.04GQTDD25 pKa = 5.07ALALWIEE32 pKa = 4.22VAGNDD37 pKa = 4.35GASFMYY43 pKa = 10.1DD44 pKa = 2.88VYY46 pKa = 10.91FQEE49 pKa = 5.35LAQADD54 pKa = 4.29PDD56 pKa = 4.19DD57 pKa = 4.0LHH59 pKa = 8.71LHH61 pKa = 6.09FGEE64 pKa = 4.49LNVVIPKK71 pKa = 9.67TSIAQLNGATLEE83 pKa = 4.2VGGDD87 pKa = 3.65GEE89 pKa = 5.11LAITNPNTPTPEE101 pKa = 4.68ASDD104 pKa = 4.54LPDD107 pKa = 4.89LGPEE111 pKa = 3.85ALANDD116 pKa = 3.95LALRR120 pKa = 11.84VNAILEE126 pKa = 4.35EE127 pKa = 4.18QVNPAIAAHH136 pKa = 6.43GGYY139 pKa = 10.41AEE141 pKa = 4.34LVGVVDD147 pKa = 4.04ARR149 pKa = 11.84AYY151 pKa = 10.26VLMGGGCQGCGLAAMTLSQGIATAIQEE178 pKa = 4.47AVPEE182 pKa = 4.1IVDD185 pKa = 3.36IVDD188 pKa = 3.8VTNHH192 pKa = 6.18AAGNNPYY199 pKa = 9.62YY200 pKa = 10.65QPAKK204 pKa = 10.23KK205 pKa = 10.29
Molecular weight: 21.38 kDa
Isoelectric point according different methods:
Protein with the highest isoelectric point:
>tr|A0A0D8FVA5|A0A0D8FVA5_9ACTN Uncharacterized protein OS=Ferrimicrobium acidiphilum DSM 19497 OX=1121877 GN=FEAC_20590 PE=4 SV=1
MM1 pKa = 7.43ARR3 pKa = 11.84GVGLNTHH10 pKa = 5.67TLGFKK15 pKa = 10.64GSVAFTSAAIVLVRR29 pKa = 11.84SRR31 pKa = 11.84ASPSNRR37 pKa = 11.84AVRR40 pKa = 11.84QAHH43 pKa = 5.77GGGPRR48 pKa = 11.84RR49 pKa = 11.84QAMLLGNRR57 pKa = 11.84RR58 pKa = 11.84SS59 pKa = 3.32
MM1 pKa = 7.43ARR3 pKa = 11.84GVGLNTHH10 pKa = 5.67TLGFKK15 pKa = 10.64GSVAFTSAAIVLVRR29 pKa = 11.84SRR31 pKa = 11.84ASPSNRR37 pKa = 11.84AVRR40 pKa = 11.84QAHH43 pKa = 5.77GGGPRR48 pKa = 11.84RR49 pKa = 11.84QAMLLGNRR57 pKa = 11.84RR58 pKa = 11.84SS59 pKa = 3.32
Molecular weight: 6.2 kDa
Isoelectric point according different methods:
Peptides (in silico digests for buttom-up proteomics)
Below you can find in silico digests of the whole proteome with Trypsin, Chymotrypsin, Trypsin+LysC, LysN, ArgC proteases suitable for different mass spec machines.| Try ESI |
 |
|---|
| ChTry ESI |
 |
|---|
| ArgC ESI |
 |
|---|
| LysN ESI |
 |
|---|
| TryLysC ESI |
 |
|---|
| Try MALDI |
 |
|---|
| ChTry MALDI |
 |
|---|
| ArgC MALDI |
 |
|---|
| LysN MALDI |
 |
|---|
| TryLysC MALDI |
 |
|---|
| Try LTQ |
 |
|---|
| ChTry LTQ |
 |
|---|
| ArgC LTQ |
 |
|---|
| LysN LTQ |
 |
|---|
| TryLysC LTQ |
 |
|---|
| Try MSlow |
 |
|---|
| ChTry MSlow |
 |
|---|
| ArgC MSlow |
 |
|---|
| LysN MSlow |
 |
|---|
| TryLysC MSlow |
 |
|---|
| Try MShigh |
 |
|---|
| ChTry MShigh |
 |
|---|
| ArgC MShigh |
 |
|---|
| LysN MShigh |
 |
|---|
| TryLysC MShigh |
 |
|---|
General Statistics
Number of major isoforms |
Number of additional isoforms |
Number of all proteins |
Number of amino acids |
Min. Seq. Length |
Max. Seq. Length |
Avg. Seq. Length |
Avg. Mol. Weight |
|---|---|---|---|---|---|---|---|
0 |
857107 |
29 |
1825 |
288.2 |
31.34 |
Amino acid frequency
Ala |
Cys |
Asp |
Glu |
Phe |
Gly |
His |
Ile |
Lys |
Leu |
|---|---|---|---|---|---|---|---|---|---|
10.484 ± 0.049 | 0.85 ± 0.014 |
5.289 ± 0.043 | 5.834 ± 0.048 |
3.309 ± 0.024 | 8.18 ± 0.044 |
2.265 ± 0.021 | 5.364 ± 0.035 |
2.664 ± 0.032 | 10.878 ± 0.054 |
Met |
Asn |
Gln |
Pro |
Arg |
Ser |
Thr |
Val |
Trp |
Tyr |
|---|---|---|---|---|---|---|---|---|---|
2.067 ± 0.018 | 2.666 ± 0.028 |
4.935 ± 0.029 | 3.272 ± 0.026 |
6.992 ± 0.047 | 7.122 ± 0.05 |
5.793 ± 0.052 | 8.354 ± 0.046 |
1.294 ± 0.019 | 2.387 ± 0.022 |
Most of the basic statistics you can see at this page can be downloaded from this CSV file
Proteome-pI is available under Creative Commons Attribution-NoDerivs license, for more details see here
| Reference: Kozlowski LP. Proteome-pI 2.0: Proteome Isoelectric Point Database Update. Nucleic Acids Res. 2021, doi: 10.1093/nar/gkab944 | Contact: Lukasz P. Kozlowski |
