Thermoplasmatales archaeon A-plasma
Taxonomy: cellular organisms; Archaea; Candidatus Thermoplasmatota; Thermoplasmata; Thermoplasmatales; unclassified Thermoplasmatales
Average proteome isoelectric point is 6.7
Get precalculated fractions of proteins
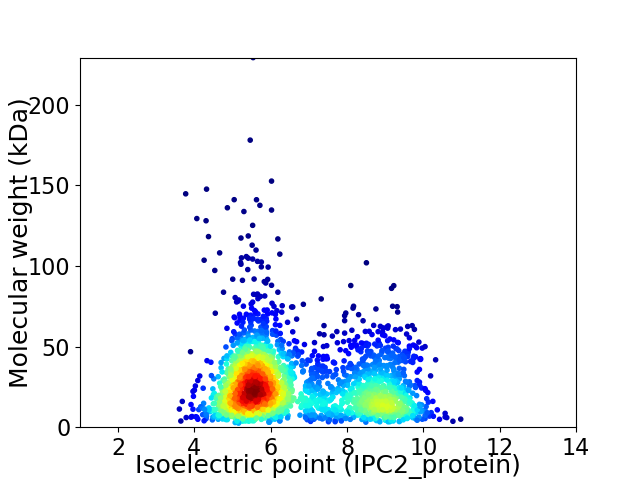
Virtual 2D-PAGE plot for 2276 proteins (isoelectric point calculated using IPC2_protein)
Get csv file with sequences according to given criteria:
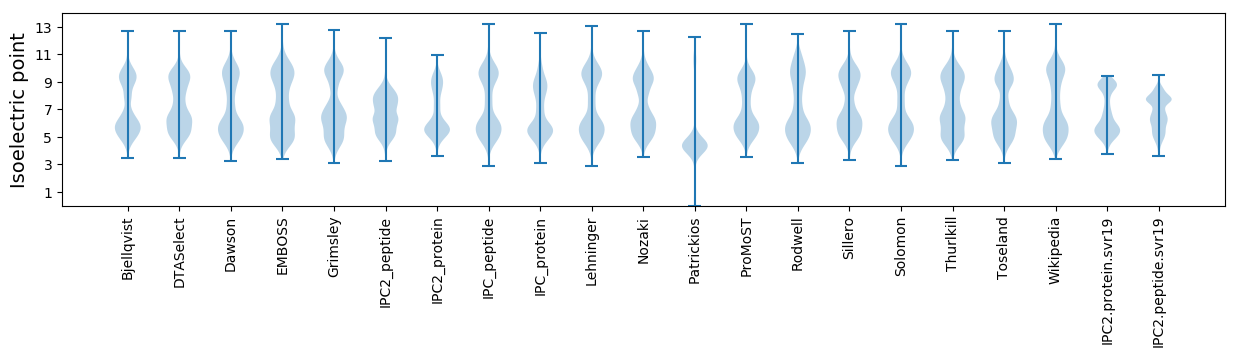
* You can choose from 21 different methods for calculating isoelectric point
Summary statistics related to proteome-wise predictions
Protein with the lowest isoelectric point:
>tr|T0M4U8|T0M4U8_9ARCH Major facilitator superfamily MFS_1 OS=Thermoplasmatales archaeon A-plasma OX=667135 GN=AMDU1_APLC00016G0024 PE=4 SV=1
MM1 pKa = 7.24TLKK4 pKa = 10.7LDD6 pKa = 3.42ARR8 pKa = 11.84LLYY11 pKa = 10.51EE12 pKa = 4.37IMSEE16 pKa = 3.9FHH18 pKa = 6.05TLGDD22 pKa = 3.89EE23 pKa = 4.4EE24 pKa = 5.11YY25 pKa = 10.36GGQGTFQEE33 pKa = 5.18AILVGYY39 pKa = 9.98IYY41 pKa = 11.18GLLTEE46 pKa = 4.87NPSSVMTLDD55 pKa = 3.54SGTHH59 pKa = 5.38KK60 pKa = 10.41VFSYY64 pKa = 10.77GGYY67 pKa = 10.16SYY69 pKa = 10.48IIWFDD74 pKa = 3.55EE75 pKa = 4.11IYY77 pKa = 10.53AYY79 pKa = 10.48AEE81 pKa = 4.2DD82 pKa = 5.69DD83 pKa = 3.73EE84 pKa = 5.63DD85 pKa = 3.7EE86 pKa = 5.12KK87 pKa = 11.41EE88 pKa = 4.24PHH90 pKa = 6.51DD91 pKa = 3.73QATEE95 pKa = 3.96TFEE98 pKa = 4.75VKK100 pKa = 10.2IEE102 pKa = 4.21DD103 pKa = 3.66VSEE106 pKa = 4.62DD107 pKa = 3.93DD108 pKa = 5.62DD109 pKa = 6.15RR110 pKa = 11.84EE111 pKa = 4.36GDD113 pKa = 3.59DD114 pKa = 5.44DD115 pKa = 4.4EE116 pKa = 6.6AVLLPVAVEE125 pKa = 4.6GPYY128 pKa = 9.77TADD131 pKa = 4.66DD132 pKa = 3.78IKK134 pKa = 11.51DD135 pKa = 3.73FLANGDD141 pKa = 3.9LL142 pKa = 4.0
MM1 pKa = 7.24TLKK4 pKa = 10.7LDD6 pKa = 3.42ARR8 pKa = 11.84LLYY11 pKa = 10.51EE12 pKa = 4.37IMSEE16 pKa = 3.9FHH18 pKa = 6.05TLGDD22 pKa = 3.89EE23 pKa = 4.4EE24 pKa = 5.11YY25 pKa = 10.36GGQGTFQEE33 pKa = 5.18AILVGYY39 pKa = 9.98IYY41 pKa = 11.18GLLTEE46 pKa = 4.87NPSSVMTLDD55 pKa = 3.54SGTHH59 pKa = 5.38KK60 pKa = 10.41VFSYY64 pKa = 10.77GGYY67 pKa = 10.16SYY69 pKa = 10.48IIWFDD74 pKa = 3.55EE75 pKa = 4.11IYY77 pKa = 10.53AYY79 pKa = 10.48AEE81 pKa = 4.2DD82 pKa = 5.69DD83 pKa = 3.73EE84 pKa = 5.63DD85 pKa = 3.7EE86 pKa = 5.12KK87 pKa = 11.41EE88 pKa = 4.24PHH90 pKa = 6.51DD91 pKa = 3.73QATEE95 pKa = 3.96TFEE98 pKa = 4.75VKK100 pKa = 10.2IEE102 pKa = 4.21DD103 pKa = 3.66VSEE106 pKa = 4.62DD107 pKa = 3.93DD108 pKa = 5.62DD109 pKa = 6.15RR110 pKa = 11.84EE111 pKa = 4.36GDD113 pKa = 3.59DD114 pKa = 5.44DD115 pKa = 4.4EE116 pKa = 6.6AVLLPVAVEE125 pKa = 4.6GPYY128 pKa = 9.77TADD131 pKa = 4.66DD132 pKa = 3.78IKK134 pKa = 11.51DD135 pKa = 3.73FLANGDD141 pKa = 3.9LL142 pKa = 4.0
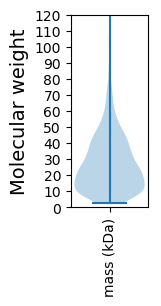
Molecular weight: 16.0 kDa
Isoelectric point according different methods:
Protein with the highest isoelectric point:
>tr|T0NAW7|T0NAW7_9ARCH ABC transporter ATP-binding protein OS=Thermoplasmatales archaeon A-plasma OX=667135 GN=AMDU1_APLC00044G0033 PE=4 SV=1
MM1 pKa = 7.91RR2 pKa = 11.84GGDD5 pKa = 3.13RR6 pKa = 11.84TAKK9 pKa = 10.22KK10 pKa = 9.93RR11 pKa = 11.84IKK13 pKa = 9.96RR14 pKa = 11.84RR15 pKa = 11.84KK16 pKa = 7.22ATNAAKK22 pKa = 10.07RR23 pKa = 11.84RR24 pKa = 11.84KK25 pKa = 7.87PTRR28 pKa = 11.84KK29 pKa = 9.32PKK31 pKa = 10.36GKK33 pKa = 8.59KK34 pKa = 5.8TRR36 pKa = 11.84KK37 pKa = 7.15RR38 pKa = 11.84TGRR41 pKa = 11.84RR42 pKa = 3.18
MM1 pKa = 7.91RR2 pKa = 11.84GGDD5 pKa = 3.13RR6 pKa = 11.84TAKK9 pKa = 10.22KK10 pKa = 9.93RR11 pKa = 11.84IKK13 pKa = 9.96RR14 pKa = 11.84RR15 pKa = 11.84KK16 pKa = 7.22ATNAAKK22 pKa = 10.07RR23 pKa = 11.84RR24 pKa = 11.84KK25 pKa = 7.87PTRR28 pKa = 11.84KK29 pKa = 9.32PKK31 pKa = 10.36GKK33 pKa = 8.59KK34 pKa = 5.8TRR36 pKa = 11.84KK37 pKa = 7.15RR38 pKa = 11.84TGRR41 pKa = 11.84RR42 pKa = 3.18
Molecular weight: 4.99 kDa
Isoelectric point according different methods:
Peptides (in silico digests for buttom-up proteomics)
Below you can find in silico digests of the whole proteome with Trypsin, Chymotrypsin, Trypsin+LysC, LysN, ArgC proteases suitable for different mass spec machines.| Try ESI |
 |
|---|
| ChTry ESI |
|
|---|
| ArgC ESI |
|
|---|
| LysN ESI |
|
|---|
| TryLysC ESI |
|
|---|
| Try MALDI |
|
|---|
| ChTry MALDI |
|
|---|
| ArgC MALDI |
|
|---|
| LysN MALDI |
|
|---|
| TryLysC MALDI |
|
|---|
| Try LTQ |
|
|---|
| ChTry LTQ |
|
|---|
| ArgC LTQ |
|
|---|
| LysN LTQ |
|
|---|
| TryLysC LTQ |
|
|---|
| Try MSlow |
|
|---|
| ChTry MSlow |
|
|---|
| ArgC MSlow |
|
|---|
| LysN MSlow |
|
|---|
| TryLysC MSlow |
|
|---|
| Try MShigh |
|
|---|
| ChTry MShigh |
|
|---|
| ArgC MShigh |
|
|---|
| LysN MShigh |
|
|---|
| TryLysC MShigh |
|
|---|
General Statistics
Number of major isoforms |
Number of additional isoforms |
Number of all proteins |
Number of amino acids |
Min. Seq. Length |
Max. Seq. Length |
Avg. Seq. Length |
Avg. Mol. Weight |
|---|---|---|---|---|---|---|---|
0 |
587698 |
24 |
2121 |
258.2 |
28.78 |
Amino acid frequency
Ala |
Cys |
Asp |
Glu |
Phe |
Gly |
His |
Ile |
Lys |
Leu |
|---|---|---|---|---|---|---|---|---|---|
6.973 ± 0.055 | 0.658 ± 0.016 |
5.227 ± 0.05 | 6.048 ± 0.064 |
4.642 ± 0.042 | 7.586 ± 0.05 |
1.795 ± 0.02 | 8.059 ± 0.045 |
5.293 ± 0.061 | 9.051 ± 0.055 |
Met |
Asn |
Gln |
Pro |
Arg |
Ser |
Thr |
Val |
Trp |
Tyr |
|---|---|---|---|---|---|---|---|---|---|
3.154 ± 0.028 | 4.201 ± 0.052 |
4.059 ± 0.035 | 2.522 ± 0.029 |
5.568 ± 0.058 | 8.046 ± 0.066 |
5.205 ± 0.043 | 7.092 ± 0.039 |
0.929 ± 0.018 | 3.889 ± 0.04 |
Most of the basic statistics you can see at this page can be downloaded from this CSV file
See this proteome in:

Proteome-pI is available under Creative Commons Attribution-NoDerivs license, for more details see here
| Reference: Kozlowski LP. Proteome-pI 2.0: Proteome Isoelectric Point Database Update. Nucleic Acids Res. 2021, doi: 10.1093/nar/gkab944 | Contact: Lukasz P. Kozlowski |