Firmicutes bacterium CAG:466
Taxonomy: cellular organisms; Bacteria; Terrabacteria group; Firmicutes; environmental samples
Average proteome isoelectric point is 5.97
Get precalculated fractions of proteins

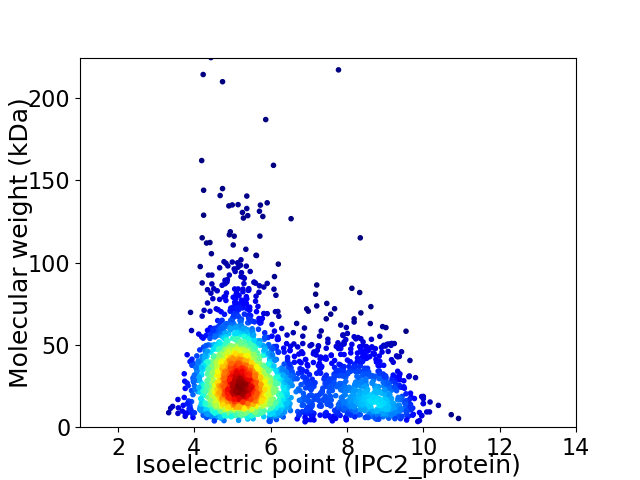
Virtual 2D-PAGE plot for 2676 proteins (isoelectric point calculated using IPC2_protein)
Get csv file with sequences according to given criteria:
* You can choose from 21 different methods for calculating isoelectric point
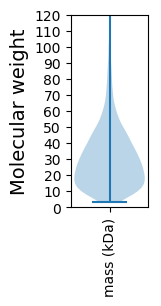
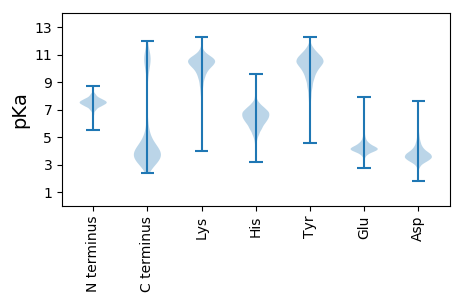
Summary statistics related to proteome-wise predictions


Protein with the lowest isoelectric point:
>tr|R6PXC2|R6PXC2_9FIRM ANTAR domain-containing protein OS=Firmicutes bacterium CAG:466 OX=1263025 GN=BN668_01785 PE=4 SV=1
MM1 pKa = 7.36HH2 pKa = 7.48CPYY5 pKa = 9.75CKK7 pKa = 10.3HH8 pKa = 6.49EE9 pKa = 4.13ISEE12 pKa = 4.13NANFCEE18 pKa = 4.14QCGKK22 pKa = 10.6KK23 pKa = 9.58IPKK26 pKa = 10.01CPTCGHH32 pKa = 6.94IIWKK36 pKa = 9.88KK37 pKa = 10.61EE38 pKa = 3.86NFCPMDD44 pKa = 3.86GTPLPSEE51 pKa = 5.15FFADD55 pKa = 3.48WPLEE59 pKa = 4.0EE60 pKa = 4.54VSLSEE65 pKa = 5.23EE66 pKa = 3.57ITAPEE71 pKa = 4.71DD72 pKa = 3.54PQQEE76 pKa = 4.18SSYY79 pKa = 11.43SEE81 pKa = 3.65MDD83 pKa = 3.31APEE86 pKa = 4.67SDD88 pKa = 3.14ITDD91 pKa = 3.46EE92 pKa = 5.1DD93 pKa = 5.55DD94 pKa = 3.53YY95 pKa = 12.13DD96 pKa = 4.07EE97 pKa = 6.46DD98 pKa = 4.4FDD100 pKa = 5.51EE101 pKa = 6.64DD102 pKa = 3.83FDD104 pKa = 5.1EE105 pKa = 6.66DD106 pKa = 4.23FDD108 pKa = 5.13EE109 pKa = 6.65DD110 pKa = 3.81FDD112 pKa = 5.82KK113 pKa = 11.52DD114 pKa = 3.55FDD116 pKa = 4.3EE117 pKa = 6.36DD118 pKa = 4.42FDD120 pKa = 5.27DD121 pKa = 5.95FEE123 pKa = 7.46DD124 pKa = 4.31YY125 pKa = 11.13DD126 pKa = 3.95EE127 pKa = 5.39SEE129 pKa = 4.42EE130 pKa = 4.78SEE132 pKa = 4.1KK133 pKa = 10.83TNWKK137 pKa = 9.56PILTAAAIIGVICVFASYY155 pKa = 10.34IAIVTGPGTLKK166 pKa = 10.23KK167 pKa = 10.33DD168 pKa = 3.55QNIHH172 pKa = 5.85VEE174 pKa = 4.2ASAKK178 pKa = 10.16QSASQEE184 pKa = 3.52ADD186 pKa = 2.73ADD188 pKa = 4.29VIFQHH193 pKa = 6.73SNYY196 pKa = 9.73TLLLPQNDD204 pKa = 3.56TMLL207 pKa = 4.64
MM1 pKa = 7.36HH2 pKa = 7.48CPYY5 pKa = 9.75CKK7 pKa = 10.3HH8 pKa = 6.49EE9 pKa = 4.13ISEE12 pKa = 4.13NANFCEE18 pKa = 4.14QCGKK22 pKa = 10.6KK23 pKa = 9.58IPKK26 pKa = 10.01CPTCGHH32 pKa = 6.94IIWKK36 pKa = 9.88KK37 pKa = 10.61EE38 pKa = 3.86NFCPMDD44 pKa = 3.86GTPLPSEE51 pKa = 5.15FFADD55 pKa = 3.48WPLEE59 pKa = 4.0EE60 pKa = 4.54VSLSEE65 pKa = 5.23EE66 pKa = 3.57ITAPEE71 pKa = 4.71DD72 pKa = 3.54PQQEE76 pKa = 4.18SSYY79 pKa = 11.43SEE81 pKa = 3.65MDD83 pKa = 3.31APEE86 pKa = 4.67SDD88 pKa = 3.14ITDD91 pKa = 3.46EE92 pKa = 5.1DD93 pKa = 5.55DD94 pKa = 3.53YY95 pKa = 12.13DD96 pKa = 4.07EE97 pKa = 6.46DD98 pKa = 4.4FDD100 pKa = 5.51EE101 pKa = 6.64DD102 pKa = 3.83FDD104 pKa = 5.1EE105 pKa = 6.66DD106 pKa = 4.23FDD108 pKa = 5.13EE109 pKa = 6.65DD110 pKa = 3.81FDD112 pKa = 5.82KK113 pKa = 11.52DD114 pKa = 3.55FDD116 pKa = 4.3EE117 pKa = 6.36DD118 pKa = 4.42FDD120 pKa = 5.27DD121 pKa = 5.95FEE123 pKa = 7.46DD124 pKa = 4.31YY125 pKa = 11.13DD126 pKa = 3.95EE127 pKa = 5.39SEE129 pKa = 4.42EE130 pKa = 4.78SEE132 pKa = 4.1KK133 pKa = 10.83TNWKK137 pKa = 9.56PILTAAAIIGVICVFASYY155 pKa = 10.34IAIVTGPGTLKK166 pKa = 10.23KK167 pKa = 10.33DD168 pKa = 3.55QNIHH172 pKa = 5.85VEE174 pKa = 4.2ASAKK178 pKa = 10.16QSASQEE184 pKa = 3.52ADD186 pKa = 2.73ADD188 pKa = 4.29VIFQHH193 pKa = 6.73SNYY196 pKa = 9.73TLLLPQNDD204 pKa = 3.56TMLL207 pKa = 4.64
Molecular weight: 23.56 kDa
Isoelectric point according different methods:
Protein with the highest isoelectric point:
>tr|R6R0U7|R6R0U7_9FIRM GntR family transcriptional regulator OS=Firmicutes bacterium CAG:466 OX=1263025 GN=BN668_00383 PE=4 SV=1
MM1 pKa = 7.67KK2 pKa = 8.72MTFQPKK8 pKa = 8.73KK9 pKa = 7.52RR10 pKa = 11.84QRR12 pKa = 11.84SRR14 pKa = 11.84EE15 pKa = 3.65HH16 pKa = 6.35GFRR19 pKa = 11.84KK20 pKa = 9.96RR21 pKa = 11.84MRR23 pKa = 11.84TANGRR28 pKa = 11.84KK29 pKa = 8.83VLAARR34 pKa = 11.84RR35 pKa = 11.84RR36 pKa = 11.84KK37 pKa = 8.81GRR39 pKa = 11.84KK40 pKa = 8.75VLSAA44 pKa = 4.05
MM1 pKa = 7.67KK2 pKa = 8.72MTFQPKK8 pKa = 8.73KK9 pKa = 7.52RR10 pKa = 11.84QRR12 pKa = 11.84SRR14 pKa = 11.84EE15 pKa = 3.65HH16 pKa = 6.35GFRR19 pKa = 11.84KK20 pKa = 9.96RR21 pKa = 11.84MRR23 pKa = 11.84TANGRR28 pKa = 11.84KK29 pKa = 8.83VLAARR34 pKa = 11.84RR35 pKa = 11.84RR36 pKa = 11.84KK37 pKa = 8.81GRR39 pKa = 11.84KK40 pKa = 8.75VLSAA44 pKa = 4.05
Molecular weight: 5.31 kDa
Isoelectric point according different methods:
Peptides (in silico digests for buttom-up proteomics)
Below you can find in silico digests of the whole proteome with Trypsin, Chymotrypsin, Trypsin+LysC, LysN, ArgC proteases suitable for different mass spec machines.| Try ESI |
 |
|---|
| ChTry ESI |
 |
|---|
| ArgC ESI |
 |
|---|
| LysN ESI |
 |
|---|
| TryLysC ESI |
 |
|---|
| Try MALDI |
 |
|---|
| ChTry MALDI |
 |
|---|
| ArgC MALDI |
 |
|---|
| LysN MALDI |
 |
|---|
| TryLysC MALDI |
 |
|---|
| Try LTQ |
 |
|---|
| ChTry LTQ |
 |
|---|
| ArgC LTQ |
 |
|---|
| LysN LTQ |
 |
|---|
| TryLysC LTQ |
 |
|---|
| Try MSlow |
 |
|---|
| ChTry MSlow |
 |
|---|
| ArgC MSlow |
 |
|---|
| LysN MSlow |
 |
|---|
| TryLysC MSlow |
 |
|---|
| Try MShigh |
 |
|---|
| ChTry MShigh |
 |
|---|
| ArgC MShigh |
 |
|---|
| LysN MShigh |
 |
|---|
| TryLysC MShigh |
 |
|---|
General Statistics
Number of major isoforms |
Number of additional isoforms |
Number of all proteins |
Number of amino acids |
Min. Seq. Length |
Max. Seq. Length |
Avg. Seq. Length |
Avg. Mol. Weight |
|---|---|---|---|---|---|---|---|
0 |
766065 |
29 |
2016 |
286.3 |
31.96 |
Amino acid frequency
Ala |
Cys |
Asp |
Glu |
Phe |
Gly |
His |
Ile |
Lys |
Leu |
|---|---|---|---|---|---|---|---|---|---|
8.255 ± 0.049 | 1.525 ± 0.026 |
5.449 ± 0.042 | 7.814 ± 0.055 |
4.256 ± 0.039 | 7.303 ± 0.044 |
1.79 ± 0.022 | 6.788 ± 0.045 |
6.542 ± 0.043 | 9.149 ± 0.058 |
Met |
Asn |
Gln |
Pro |
Arg |
Ser |
Thr |
Val |
Trp |
Tyr |
|---|---|---|---|---|---|---|---|---|---|
3.279 ± 0.025 | 3.923 ± 0.038 |
3.452 ± 0.027 | 3.464 ± 0.033 |
4.238 ± 0.035 | 5.214 ± 0.035 |
5.639 ± 0.041 | 7.195 ± 0.037 |
0.938 ± 0.019 | 3.786 ± 0.035 |
Most of the basic statistics you can see at this page can be downloaded from this CSV file
Proteome-pI is available under Creative Commons Attribution-NoDerivs license, for more details see here
| Reference: Kozlowski LP. Proteome-pI 2.0: Proteome Isoelectric Point Database Update. Nucleic Acids Res. 2021, doi: 10.1093/nar/gkab944 | Contact: Lukasz P. Kozlowski |
