Armillaria ostoyae (Armillaria root rot fungus)
Taxonomy: cellular organisms; Eukaryota; Opisthokonta; Fungi; Dikarya; Basidiomycota; Agaricomycotina; Agaricomycetes; Agaricomycetidae; Agaricales; Physalacriaceae; Armillaria
Average proteome isoelectric point is 6.46
Get precalculated fractions of proteins

Virtual 2D-PAGE plot for 22192 proteins (isoelectric point calculated using IPC2_protein)
Get csv file with sequences according to given criteria:
* You can choose from 21 different methods for calculating isoelectric point
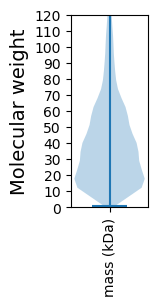
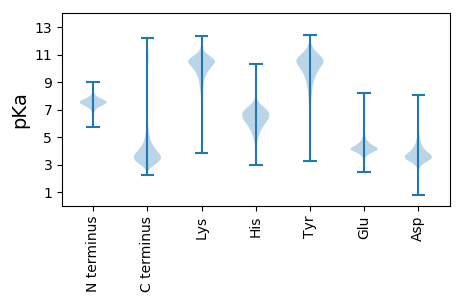
Summary statistics related to proteome-wise predictions


Protein with the lowest isoelectric point:
>tr|A0A284QTQ0|A0A284QTQ0_ARMOS Uncharacterized protein OS=Armillaria ostoyae OX=47428 GN=ARMOST_03104 PE=4 SV=1
MM1 pKa = 8.03DD2 pKa = 5.78ALDD5 pKa = 4.36EE6 pKa = 4.7GSDD9 pKa = 3.48VDD11 pKa = 3.77VTLVHH16 pKa = 6.68EE17 pKa = 4.33MLLNSVISYY26 pKa = 9.82LIEE29 pKa = 4.16MDD31 pKa = 3.95TEE33 pKa = 4.56STSPTDD39 pKa = 2.78VDD41 pKa = 5.42LNHH44 pKa = 6.97EE45 pKa = 4.6DD46 pKa = 3.52KK47 pKa = 11.37DD48 pKa = 4.03LVEE51 pKa = 4.17MLDD54 pKa = 3.68YY55 pKa = 11.1LVAKK59 pKa = 10.09AALHH63 pKa = 6.63LDD65 pKa = 5.13PIPEE69 pKa = 4.38DD70 pKa = 4.03DD71 pKa = 4.19KK72 pKa = 11.9LVDD75 pKa = 3.65NEE77 pKa = 4.29VDD79 pKa = 3.45GKK81 pKa = 9.2TDD83 pKa = 2.96SSGDD87 pKa = 3.35IEE89 pKa = 4.58TWCCEE94 pKa = 4.16VEE96 pKa = 4.48SSCDD100 pKa = 3.75DD101 pKa = 3.85EE102 pKa = 6.96LDD104 pKa = 3.83LDD106 pKa = 4.03IVPLLLCSPPYY117 pKa = 10.75GEE119 pKa = 4.7WDD121 pKa = 3.62DD122 pKa = 4.32GEE124 pKa = 4.22PVINIWDD131 pKa = 3.59VSLKK135 pKa = 10.73HH136 pKa = 6.13GLTLIEE142 pKa = 5.34PPQPWDD148 pKa = 3.4EE149 pKa = 4.11RR150 pKa = 11.84DD151 pKa = 3.5EE152 pKa = 4.67EE153 pKa = 4.32EE154 pKa = 5.45LEE156 pKa = 4.41RR157 pKa = 11.84PPPMQLLPFIPRR169 pKa = 11.84EE170 pKa = 4.18SIEE173 pKa = 4.23PEE175 pKa = 3.72AQRR178 pKa = 11.84GLWFYY183 pKa = 11.75SEE185 pKa = 4.92LSNDD189 pKa = 3.6YY190 pKa = 9.94PHH192 pKa = 7.5SFEE195 pKa = 5.0EE196 pKa = 4.25KK197 pKa = 9.36FSFINSYY204 pKa = 9.59GCKK207 pKa = 9.67EE208 pKa = 4.1SCHH211 pKa = 6.12PCSFGDD217 pKa = 3.56TVAQNVQQ224 pKa = 2.85
MM1 pKa = 8.03DD2 pKa = 5.78ALDD5 pKa = 4.36EE6 pKa = 4.7GSDD9 pKa = 3.48VDD11 pKa = 3.77VTLVHH16 pKa = 6.68EE17 pKa = 4.33MLLNSVISYY26 pKa = 9.82LIEE29 pKa = 4.16MDD31 pKa = 3.95TEE33 pKa = 4.56STSPTDD39 pKa = 2.78VDD41 pKa = 5.42LNHH44 pKa = 6.97EE45 pKa = 4.6DD46 pKa = 3.52KK47 pKa = 11.37DD48 pKa = 4.03LVEE51 pKa = 4.17MLDD54 pKa = 3.68YY55 pKa = 11.1LVAKK59 pKa = 10.09AALHH63 pKa = 6.63LDD65 pKa = 5.13PIPEE69 pKa = 4.38DD70 pKa = 4.03DD71 pKa = 4.19KK72 pKa = 11.9LVDD75 pKa = 3.65NEE77 pKa = 4.29VDD79 pKa = 3.45GKK81 pKa = 9.2TDD83 pKa = 2.96SSGDD87 pKa = 3.35IEE89 pKa = 4.58TWCCEE94 pKa = 4.16VEE96 pKa = 4.48SSCDD100 pKa = 3.75DD101 pKa = 3.85EE102 pKa = 6.96LDD104 pKa = 3.83LDD106 pKa = 4.03IVPLLLCSPPYY117 pKa = 10.75GEE119 pKa = 4.7WDD121 pKa = 3.62DD122 pKa = 4.32GEE124 pKa = 4.22PVINIWDD131 pKa = 3.59VSLKK135 pKa = 10.73HH136 pKa = 6.13GLTLIEE142 pKa = 5.34PPQPWDD148 pKa = 3.4EE149 pKa = 4.11RR150 pKa = 11.84DD151 pKa = 3.5EE152 pKa = 4.67EE153 pKa = 4.32EE154 pKa = 5.45LEE156 pKa = 4.41RR157 pKa = 11.84PPPMQLLPFIPRR169 pKa = 11.84EE170 pKa = 4.18SIEE173 pKa = 4.23PEE175 pKa = 3.72AQRR178 pKa = 11.84GLWFYY183 pKa = 11.75SEE185 pKa = 4.92LSNDD189 pKa = 3.6YY190 pKa = 9.94PHH192 pKa = 7.5SFEE195 pKa = 5.0EE196 pKa = 4.25KK197 pKa = 9.36FSFINSYY204 pKa = 9.59GCKK207 pKa = 9.67EE208 pKa = 4.1SCHH211 pKa = 6.12PCSFGDD217 pKa = 3.56TVAQNVQQ224 pKa = 2.85
Molecular weight: 25.39 kDa
Isoelectric point according different methods:
Protein with the highest isoelectric point:
>tr|A0A284SBF7|A0A284SBF7_ARMOS Uncharacterized protein OS=Armillaria ostoyae OX=47428 GN=ARMOST_21918 PE=4 SV=1
MM1 pKa = 7.93RR2 pKa = 11.84ARR4 pKa = 11.84FRR6 pKa = 11.84ASLHH10 pKa = 4.87MIKK13 pKa = 10.22RR14 pKa = 11.84QRR16 pKa = 11.84LLLL19 pKa = 4.14
MM1 pKa = 7.93RR2 pKa = 11.84ARR4 pKa = 11.84FRR6 pKa = 11.84ASLHH10 pKa = 4.87MIKK13 pKa = 10.22RR14 pKa = 11.84QRR16 pKa = 11.84LLLL19 pKa = 4.14
Molecular weight: 2.4 kDa
Isoelectric point according different methods:
Peptides (in silico digests for buttom-up proteomics)
Below you can find in silico digests of the whole proteome with Trypsin, Chymotrypsin, Trypsin+LysC, LysN, ArgC proteases suitable for different mass spec machines.| Try ESI |
 |
|---|
| ChTry ESI |
 |
|---|
| ArgC ESI |
 |
|---|
| LysN ESI |
 |
|---|
| TryLysC ESI |
 |
|---|
| Try MALDI |
 |
|---|
| ChTry MALDI |
 |
|---|
| ArgC MALDI |
 |
|---|
| LysN MALDI |
 |
|---|
| TryLysC MALDI |
 |
|---|
| Try LTQ |
 |
|---|
| ChTry LTQ |
 |
|---|
| ArgC LTQ |
 |
|---|
| LysN LTQ |
 |
|---|
| TryLysC LTQ |
 |
|---|
| Try MSlow |
 |
|---|
| ChTry MSlow |
 |
|---|
| ArgC MSlow |
 |
|---|
| LysN MSlow |
 |
|---|
| TryLysC MSlow |
 |
|---|
| Try MShigh |
 |
|---|
| ChTry MShigh |
 |
|---|
| ArgC MShigh |
 |
|---|
| LysN MShigh |
 |
|---|
| TryLysC MShigh |
 |
|---|
General Statistics
Number of major isoforms |
Number of additional isoforms |
Number of all proteins |
Number of amino acids |
Min. Seq. Length |
Max. Seq. Length |
Avg. Seq. Length |
Avg. Mol. Weight |
|---|---|---|---|---|---|---|---|
0 |
9048897 |
8 |
4981 |
407.8 |
45.41 |
Amino acid frequency
Ala |
Cys |
Asp |
Glu |
Phe |
Gly |
His |
Ile |
Lys |
Leu |
|---|---|---|---|---|---|---|---|---|---|
7.789 ± 0.013 | 1.409 ± 0.006 |
5.851 ± 0.012 | 5.852 ± 0.015 |
3.892 ± 0.009 | 6.008 ± 0.015 |
2.653 ± 0.008 | 5.273 ± 0.012 |
4.611 ± 0.015 | 9.341 ± 0.016 |
Met |
Asn |
Gln |
Pro |
Arg |
Ser |
Thr |
Val |
Trp |
Tyr |
|---|---|---|---|---|---|---|---|---|---|
2.172 ± 0.006 | 3.519 ± 0.008 |
6.358 ± 0.022 | 3.621 ± 0.009 |
6.068 ± 0.013 | 8.657 ± 0.02 |
6.137 ± 0.011 | 6.347 ± 0.012 |
1.557 ± 0.007 | 2.884 ± 0.008 |
Most of the basic statistics you can see at this page can be downloaded from this CSV file
Proteome-pI is available under Creative Commons Attribution-NoDerivs license, for more details see here
| Reference: Kozlowski LP. Proteome-pI 2.0: Proteome Isoelectric Point Database Update. Nucleic Acids Res. 2021, doi: 10.1093/nar/gkab944 | Contact: Lukasz P. Kozlowski |
