Canis familiaris polyomavirus 1
Taxonomy: Viruses; Monodnaviria; Shotokuvirae; Cossaviricota; Papovaviricetes; Sepolyvirales; Polyomaviridae; Betapolyomavirus
Average proteome isoelectric point is 6.66
Get precalculated fractions of proteins

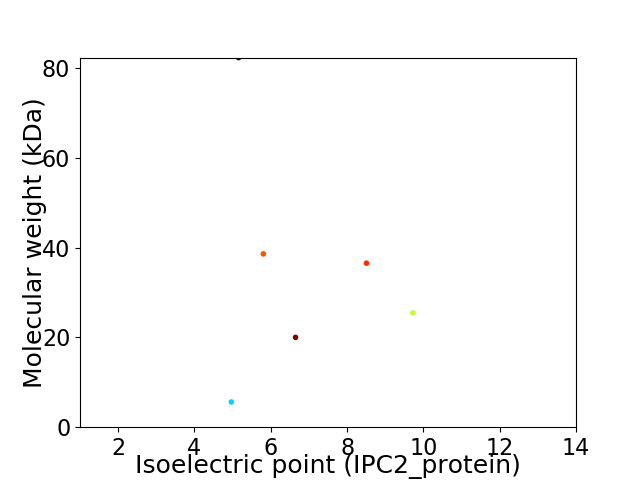
Virtual 2D-PAGE plot for 6 proteins (isoelectric point calculated using IPC2_protein)
Get csv file with sequences according to given criteria:
* You can choose from 21 different methods for calculating isoelectric point
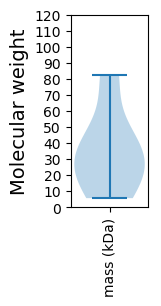
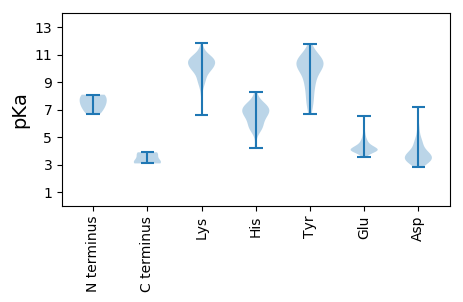
Summary statistics related to proteome-wise predictions


Protein with the lowest isoelectric point:
>tr|A0A1W6EU85|A0A1W6EU85_9POLY Large T antigen OS=Canis familiaris polyomavirus 1 OX=1980633 PE=4 SV=1
MM1 pKa = 6.71FQYY4 pKa = 10.79YY5 pKa = 10.27NKK7 pKa = 10.38LVTILLEE14 pKa = 4.73LIDD17 pKa = 4.82VIEE20 pKa = 5.41LMITLQGLRR29 pKa = 11.84TVRR32 pKa = 11.84EE33 pKa = 4.11VPEE36 pKa = 4.5DD37 pKa = 3.59CCDD40 pKa = 3.44NARR43 pKa = 11.84KK44 pKa = 9.61VWGAA48 pKa = 3.18
MM1 pKa = 6.71FQYY4 pKa = 10.79YY5 pKa = 10.27NKK7 pKa = 10.38LVTILLEE14 pKa = 4.73LIDD17 pKa = 4.82VIEE20 pKa = 5.41LMITLQGLRR29 pKa = 11.84TVRR32 pKa = 11.84EE33 pKa = 4.11VPEE36 pKa = 4.5DD37 pKa = 3.59CCDD40 pKa = 3.44NARR43 pKa = 11.84KK44 pKa = 9.61VWGAA48 pKa = 3.18
Molecular weight: 5.61 kDa
Isoelectric point according different methods:
Protein with the highest isoelectric point:
>tr|A0A1W6EU81|A0A1W6EU81_9POLY Small t antigen OS=Canis familiaris polyomavirus 1 OX=1980633 PE=4 SV=1
MM1 pKa = 7.64ALVQWVPEE9 pKa = 3.97QVDD12 pKa = 3.28ILFPGVNWLVRR23 pKa = 11.84NIHH26 pKa = 5.75YY27 pKa = 8.13FNPAIWAQEE36 pKa = 3.76AFRR39 pKa = 11.84VVWQQIQRR47 pKa = 11.84EE48 pKa = 4.43TVRR51 pKa = 11.84QIAYY55 pKa = 6.69EE56 pKa = 3.96ANRR59 pKa = 11.84AVQEE63 pKa = 4.09RR64 pKa = 11.84GQEE67 pKa = 3.95VGQQLGQLAVDD78 pKa = 4.9GIARR82 pKa = 11.84VIEE85 pKa = 4.02NGQWVLSTTPEE96 pKa = 4.34RR97 pKa = 11.84IASGVSSAYY106 pKa = 10.0QGLASYY112 pKa = 10.24YY113 pKa = 10.67GQLTHH118 pKa = 6.91IRR120 pKa = 11.84PSQQSQVARR129 pKa = 11.84SLQVGQQAGPISFTTPQSGEE149 pKa = 3.96FIKK152 pKa = 10.79QYY154 pKa = 10.53DD155 pKa = 3.91SPGGAEE161 pKa = 4.72QRR163 pKa = 11.84RR164 pKa = 11.84CPNWLLPLILGFYY177 pKa = 7.45NTPVWTAAKK186 pKa = 10.12KK187 pKa = 10.2KK188 pKa = 10.7VEE190 pKa = 3.94EE191 pKa = 4.21TKK193 pKa = 10.64PKK195 pKa = 9.92NVYY198 pKa = 9.99RR199 pKa = 11.84KK200 pKa = 8.77RR201 pKa = 11.84KK202 pKa = 9.33SSASSKK208 pKa = 9.09TNYY211 pKa = 8.81KK212 pKa = 9.72RR213 pKa = 11.84RR214 pKa = 11.84RR215 pKa = 11.84ISTRR219 pKa = 11.84VKK221 pKa = 10.5NRR223 pKa = 11.84AA224 pKa = 3.08
MM1 pKa = 7.64ALVQWVPEE9 pKa = 3.97QVDD12 pKa = 3.28ILFPGVNWLVRR23 pKa = 11.84NIHH26 pKa = 5.75YY27 pKa = 8.13FNPAIWAQEE36 pKa = 3.76AFRR39 pKa = 11.84VVWQQIQRR47 pKa = 11.84EE48 pKa = 4.43TVRR51 pKa = 11.84QIAYY55 pKa = 6.69EE56 pKa = 3.96ANRR59 pKa = 11.84AVQEE63 pKa = 4.09RR64 pKa = 11.84GQEE67 pKa = 3.95VGQQLGQLAVDD78 pKa = 4.9GIARR82 pKa = 11.84VIEE85 pKa = 4.02NGQWVLSTTPEE96 pKa = 4.34RR97 pKa = 11.84IASGVSSAYY106 pKa = 10.0QGLASYY112 pKa = 10.24YY113 pKa = 10.67GQLTHH118 pKa = 6.91IRR120 pKa = 11.84PSQQSQVARR129 pKa = 11.84SLQVGQQAGPISFTTPQSGEE149 pKa = 3.96FIKK152 pKa = 10.79QYY154 pKa = 10.53DD155 pKa = 3.91SPGGAEE161 pKa = 4.72QRR163 pKa = 11.84RR164 pKa = 11.84CPNWLLPLILGFYY177 pKa = 7.45NTPVWTAAKK186 pKa = 10.12KK187 pKa = 10.2KK188 pKa = 10.7VEE190 pKa = 3.94EE191 pKa = 4.21TKK193 pKa = 10.64PKK195 pKa = 9.92NVYY198 pKa = 9.99RR199 pKa = 11.84KK200 pKa = 8.77RR201 pKa = 11.84KK202 pKa = 9.33SSASSKK208 pKa = 9.09TNYY211 pKa = 8.81KK212 pKa = 9.72RR213 pKa = 11.84RR214 pKa = 11.84RR215 pKa = 11.84ISTRR219 pKa = 11.84VKK221 pKa = 10.5NRR223 pKa = 11.84AA224 pKa = 3.08
Molecular weight: 25.47 kDa
Isoelectric point according different methods:
Peptides (in silico digests for buttom-up proteomics)
Below you can find in silico digests of the whole proteome with Trypsin, Chymotrypsin, Trypsin+LysC, LysN, ArgC proteases suitable for different mass spec machines.| Try ESI |
 |
|---|
| ChTry ESI |
 |
|---|
| ArgC ESI |
 |
|---|
| LysN ESI |
 |
|---|
| TryLysC ESI |
 |
|---|
| Try MALDI |
 |
|---|
| ChTry MALDI |
 |
|---|
| ArgC MALDI |
 |
|---|
| LysN MALDI |
 |
|---|
| TryLysC MALDI |
 |
|---|
| Try LTQ |
 |
|---|
| ChTry LTQ |
 |
|---|
| ArgC LTQ |
 |
|---|
| LysN LTQ |
 |
|---|
| TryLysC LTQ |
 |
|---|
| Try MSlow |
 |
|---|
| ChTry MSlow |
 |
|---|
| ArgC MSlow |
 |
|---|
| LysN MSlow |
 |
|---|
| TryLysC MSlow |
 |
|---|
| Try MShigh |
 |
|---|
| ChTry MShigh |
 |
|---|
| ArgC MShigh |
 |
|---|
| LysN MShigh |
 |
|---|
| TryLysC MShigh |
 |
|---|
General Statistics
Number of major isoforms |
Number of additional isoforms |
Number of all proteins |
Number of amino acids |
Min. Seq. Length |
Max. Seq. Length |
Avg. Seq. Length |
Avg. Mol. Weight |
|---|---|---|---|---|---|---|---|
0 |
1847 |
48 |
707 |
307.8 |
34.76 |
Amino acid frequency
Ala |
Cys |
Asp |
Glu |
Phe |
Gly |
His |
Ile |
Lys |
Leu |
|---|---|---|---|---|---|---|---|---|---|
5.956 ± 1.519 | 2.653 ± 0.802 |
4.115 ± 0.889 | 7.58 ± 1.231 |
3.573 ± 0.629 | 7.093 ± 1.09 |
1.408 ± 0.239 | 4.981 ± 0.504 |
6.605 ± 1.371 | 9.15 ± 0.775 |
Met |
Asn |
Gln |
Pro |
Arg |
Ser |
Thr |
Val |
Trp |
Tyr |
|---|---|---|---|---|---|---|---|---|---|
2.382 ± 0.475 | 5.793 ± 0.717 |
4.169 ± 0.74 | 6.064 ± 0.832 |
4.656 ± 0.787 | 5.739 ± 0.948 |
5.793 ± 0.835 | 7.093 ± 0.776 |
2.112 ± 0.539 | 3.086 ± 0.158 |
Most of the basic statistics you can see at this page can be downloaded from this CSV file
Proteome-pI is available under Creative Commons Attribution-NoDerivs license, for more details see here
| Reference: Kozlowski LP. Proteome-pI 2.0: Proteome Isoelectric Point Database Update. Nucleic Acids Res. 2021, doi: 10.1093/nar/gkab944 | Contact: Lukasz P. Kozlowski |
