Avon-Heathcote Estuary associated kieseladnavirus (AHEaBV) (Avon-Heathcote Estuary associated bacilladnavirus)
Taxonomy: Viruses; Monodnaviria; Shotokuvirae; Cressdnaviricota; Arfiviricetes; Baphyvirales; Bacilladnaviridae; Kieseladnavirus
Average proteome isoelectric point is 6.61
Get precalculated fractions of proteins

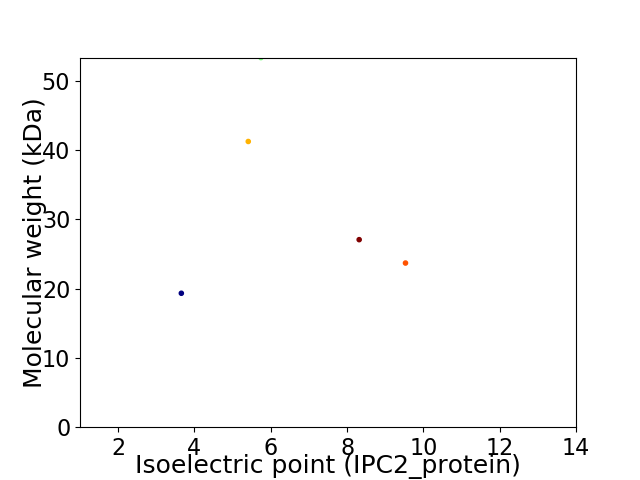
Virtual 2D-PAGE plot for 5 proteins (isoelectric point calculated using IPC2_protein)
Get csv file with sequences according to given criteria:
* You can choose from 21 different methods for calculating isoelectric point
Summary statistics related to proteome-wise predictions


Protein with the lowest isoelectric point:
>tr|A0A1P8YT84|A0A1P8YT84_AHEBV p3 OS=Avon-Heathcote Estuary associated kieseladnavirus OX=2169964 PE=4 SV=1
MM1 pKa = 7.41CRR3 pKa = 11.84ASSMDD8 pKa = 3.47SPTLRR13 pKa = 11.84TSQVNEE19 pKa = 3.62FLNFGDD25 pKa = 4.37RR26 pKa = 11.84NVHH29 pKa = 5.08VDD31 pKa = 3.63NIVRR35 pKa = 11.84LLDD38 pKa = 3.65FLVDD42 pKa = 4.07GGSFTPQQADD52 pKa = 4.21LYY54 pKa = 9.21WNALYY59 pKa = 10.35EE60 pKa = 4.51HH61 pKa = 6.49YY62 pKa = 10.58HH63 pKa = 6.53HH64 pKa = 7.02GVLPGMEE71 pKa = 4.44RR72 pKa = 11.84FPLPGIDD79 pKa = 3.34RR80 pKa = 11.84EE81 pKa = 4.67LYY83 pKa = 9.88FLPALTVLFDD93 pKa = 4.0NYY95 pKa = 10.16IDD97 pKa = 4.89PPTQLEE103 pKa = 4.31SIRR106 pKa = 11.84IEE108 pKa = 3.69WSEE111 pKa = 4.1EE112 pKa = 3.84VLSDD116 pKa = 3.71TDD118 pKa = 3.83SLTDD122 pKa = 3.63SEE124 pKa = 5.55LSDD127 pKa = 3.97LVGDD131 pKa = 4.91IIDD134 pKa = 4.39PDD136 pKa = 4.16SVIDD140 pKa = 3.72EE141 pKa = 4.61CLLAVINGEE150 pKa = 4.1LGDD153 pKa = 3.69VGGDD157 pKa = 3.33VGQDD161 pKa = 3.67DD162 pKa = 5.76LSDD165 pKa = 4.02ASDD168 pKa = 3.74GTDD171 pKa = 2.86TLFF174 pKa = 4.91
MM1 pKa = 7.41CRR3 pKa = 11.84ASSMDD8 pKa = 3.47SPTLRR13 pKa = 11.84TSQVNEE19 pKa = 3.62FLNFGDD25 pKa = 4.37RR26 pKa = 11.84NVHH29 pKa = 5.08VDD31 pKa = 3.63NIVRR35 pKa = 11.84LLDD38 pKa = 3.65FLVDD42 pKa = 4.07GGSFTPQQADD52 pKa = 4.21LYY54 pKa = 9.21WNALYY59 pKa = 10.35EE60 pKa = 4.51HH61 pKa = 6.49YY62 pKa = 10.58HH63 pKa = 6.53HH64 pKa = 7.02GVLPGMEE71 pKa = 4.44RR72 pKa = 11.84FPLPGIDD79 pKa = 3.34RR80 pKa = 11.84EE81 pKa = 4.67LYY83 pKa = 9.88FLPALTVLFDD93 pKa = 4.0NYY95 pKa = 10.16IDD97 pKa = 4.89PPTQLEE103 pKa = 4.31SIRR106 pKa = 11.84IEE108 pKa = 3.69WSEE111 pKa = 4.1EE112 pKa = 3.84VLSDD116 pKa = 3.71TDD118 pKa = 3.83SLTDD122 pKa = 3.63SEE124 pKa = 5.55LSDD127 pKa = 3.97LVGDD131 pKa = 4.91IIDD134 pKa = 4.39PDD136 pKa = 4.16SVIDD140 pKa = 3.72EE141 pKa = 4.61CLLAVINGEE150 pKa = 4.1LGDD153 pKa = 3.69VGGDD157 pKa = 3.33VGQDD161 pKa = 3.67DD162 pKa = 5.76LSDD165 pKa = 4.02ASDD168 pKa = 3.74GTDD171 pKa = 2.86TLFF174 pKa = 4.91
Molecular weight: 19.33 kDa
Isoelectric point according different methods:
Protein with the highest isoelectric point:
>sp|A0A1P8YT88|CAPSD_AHEBV Capsid protein OS=Avon-Heathcote Estuary associated kieseladnavirus OX=2169964 PE=4 SV=1
MM1 pKa = 7.63RR2 pKa = 11.84RR3 pKa = 11.84TRR5 pKa = 11.84SRR7 pKa = 11.84SWTPGTPPRR16 pKa = 11.84KK17 pKa = 9.4KK18 pKa = 10.14SEE20 pKa = 3.96RR21 pKa = 11.84CHH23 pKa = 5.98VVSRR27 pKa = 11.84DD28 pKa = 3.36PARR31 pKa = 11.84RR32 pKa = 11.84LPWSRR37 pKa = 11.84NRR39 pKa = 11.84TDD41 pKa = 4.0ARR43 pKa = 11.84PSQAKK48 pKa = 9.05PVSKK52 pKa = 10.66KK53 pKa = 8.84PTATALMRR61 pKa = 11.84IPTVQAVKK69 pKa = 10.6KK70 pKa = 9.09EE71 pKa = 3.94YY72 pKa = 8.83HH73 pKa = 5.54TALTVKK79 pKa = 10.21QQDD82 pKa = 3.05KK83 pKa = 10.57RR84 pKa = 11.84RR85 pKa = 11.84EE86 pKa = 4.31SKK88 pKa = 10.47FKK90 pKa = 10.09QALRR94 pKa = 11.84EE95 pKa = 4.12TKK97 pKa = 9.78RR98 pKa = 11.84VKK100 pKa = 10.56DD101 pKa = 3.49SIMRR105 pKa = 11.84GIEE108 pKa = 3.86YY109 pKa = 7.42TAHH112 pKa = 5.67VAGEE116 pKa = 4.02VSKK119 pKa = 11.14VVEE122 pKa = 4.13PLALGGSAAQPEE134 pKa = 4.59MAEE137 pKa = 4.14FLLPAAGIADD147 pKa = 3.79VVKK150 pKa = 10.34RR151 pKa = 11.84KK152 pKa = 9.49AAIIEE157 pKa = 4.29KK158 pKa = 8.44TAKK161 pKa = 9.99AAQGDD166 pKa = 3.57RR167 pKa = 11.84DD168 pKa = 3.98AYY170 pKa = 10.13KK171 pKa = 10.82SLTDD175 pKa = 3.11TGKK178 pKa = 8.31YY179 pKa = 8.31QKK181 pKa = 10.35MMLEE185 pKa = 4.18AKK187 pKa = 9.82NRR189 pKa = 11.84PKK191 pKa = 10.91VNLIEE196 pKa = 4.05YY197 pKa = 9.52VPRR200 pKa = 11.84AEE202 pKa = 4.4DD203 pKa = 3.46LQIEE207 pKa = 4.61MIDD210 pKa = 3.3
MM1 pKa = 7.63RR2 pKa = 11.84RR3 pKa = 11.84TRR5 pKa = 11.84SRR7 pKa = 11.84SWTPGTPPRR16 pKa = 11.84KK17 pKa = 9.4KK18 pKa = 10.14SEE20 pKa = 3.96RR21 pKa = 11.84CHH23 pKa = 5.98VVSRR27 pKa = 11.84DD28 pKa = 3.36PARR31 pKa = 11.84RR32 pKa = 11.84LPWSRR37 pKa = 11.84NRR39 pKa = 11.84TDD41 pKa = 4.0ARR43 pKa = 11.84PSQAKK48 pKa = 9.05PVSKK52 pKa = 10.66KK53 pKa = 8.84PTATALMRR61 pKa = 11.84IPTVQAVKK69 pKa = 10.6KK70 pKa = 9.09EE71 pKa = 3.94YY72 pKa = 8.83HH73 pKa = 5.54TALTVKK79 pKa = 10.21QQDD82 pKa = 3.05KK83 pKa = 10.57RR84 pKa = 11.84RR85 pKa = 11.84EE86 pKa = 4.31SKK88 pKa = 10.47FKK90 pKa = 10.09QALRR94 pKa = 11.84EE95 pKa = 4.12TKK97 pKa = 9.78RR98 pKa = 11.84VKK100 pKa = 10.56DD101 pKa = 3.49SIMRR105 pKa = 11.84GIEE108 pKa = 3.86YY109 pKa = 7.42TAHH112 pKa = 5.67VAGEE116 pKa = 4.02VSKK119 pKa = 11.14VVEE122 pKa = 4.13PLALGGSAAQPEE134 pKa = 4.59MAEE137 pKa = 4.14FLLPAAGIADD147 pKa = 3.79VVKK150 pKa = 10.34RR151 pKa = 11.84KK152 pKa = 9.49AAIIEE157 pKa = 4.29KK158 pKa = 8.44TAKK161 pKa = 9.99AAQGDD166 pKa = 3.57RR167 pKa = 11.84DD168 pKa = 3.98AYY170 pKa = 10.13KK171 pKa = 10.82SLTDD175 pKa = 3.11TGKK178 pKa = 8.31YY179 pKa = 8.31QKK181 pKa = 10.35MMLEE185 pKa = 4.18AKK187 pKa = 9.82NRR189 pKa = 11.84PKK191 pKa = 10.91VNLIEE196 pKa = 4.05YY197 pKa = 9.52VPRR200 pKa = 11.84AEE202 pKa = 4.4DD203 pKa = 3.46LQIEE207 pKa = 4.61MIDD210 pKa = 3.3
Molecular weight: 23.69 kDa
Isoelectric point according different methods:
Peptides (in silico digests for buttom-up proteomics)
Below you can find in silico digests of the whole proteome with Trypsin, Chymotrypsin, Trypsin+LysC, LysN, ArgC proteases suitable for different mass spec machines.| Try ESI |
 |
|---|
| ChTry ESI |
 |
|---|
| ArgC ESI |
 |
|---|
| LysN ESI |
 |
|---|
| TryLysC ESI |
 |
|---|
| Try MALDI |
 |
|---|
| ChTry MALDI |
 |
|---|
| ArgC MALDI |
 |
|---|
| LysN MALDI |
 |
|---|
| TryLysC MALDI |
 |
|---|
| Try LTQ |
 |
|---|
| ChTry LTQ |
 |
|---|
| ArgC LTQ |
 |
|---|
| LysN LTQ |
 |
|---|
| TryLysC LTQ |
 |
|---|
| Try MSlow |
 |
|---|
| ChTry MSlow |
 |
|---|
| ArgC MSlow |
 |
|---|
| LysN MSlow |
 |
|---|
| TryLysC MSlow |
 |
|---|
| Try MShigh |
 |
|---|
| ChTry MShigh |
 |
|---|
| ArgC MShigh |
 |
|---|
| LysN MShigh |
 |
|---|
| TryLysC MShigh |
 |
|---|
General Statistics
Number of major isoforms |
Number of additional isoforms |
Number of all proteins |
Number of amino acids |
Min. Seq. Length |
Max. Seq. Length |
Avg. Seq. Length |
Avg. Mol. Weight |
|---|---|---|---|---|---|---|---|
0 |
1462 |
174 |
474 |
292.4 |
32.93 |
Amino acid frequency
Ala |
Cys |
Asp |
Glu |
Phe |
Gly |
His |
Ile |
Lys |
Leu |
|---|---|---|---|---|---|---|---|---|---|
7.524 ± 0.893 | 1.984 ± 0.569 |
7.182 ± 1.275 | 5.267 ± 0.396 |
4.856 ± 0.839 | 5.609 ± 0.923 |
2.804 ± 0.421 | 4.993 ± 0.265 |
5.472 ± 1.304 | 8.96 ± 1.526 |
Met |
Asn |
Gln |
Pro |
Arg |
Ser |
Thr |
Val |
Trp |
Tyr |
|---|---|---|---|---|---|---|---|---|---|
2.531 ± 0.615 | 3.967 ± 1.198 |
4.925 ± 0.855 | 3.557 ± 0.764 |
6.019 ± 0.881 | 7.25 ± 0.486 |
7.182 ± 0.573 | 5.814 ± 0.463 |
2.052 ± 0.454 | 2.052 ± 0.261 |
Most of the basic statistics you can see at this page can be downloaded from this CSV file
Proteome-pI is available under Creative Commons Attribution-NoDerivs license, for more details see here
| Reference: Kozlowski LP. Proteome-pI 2.0: Proteome Isoelectric Point Database Update. Nucleic Acids Res. 2021, doi: 10.1093/nar/gkab944 | Contact: Lukasz P. Kozlowski |
