Bathycoccus prasinos
Taxonomy: cellular organisms; Eukaryota; Viridiplantae; Chlorophyta; Mamiellophyceae; Mamiellales; Bathycoccaceae; Bathycoccus
Average proteome isoelectric point is 6.57
Get precalculated fractions of proteins

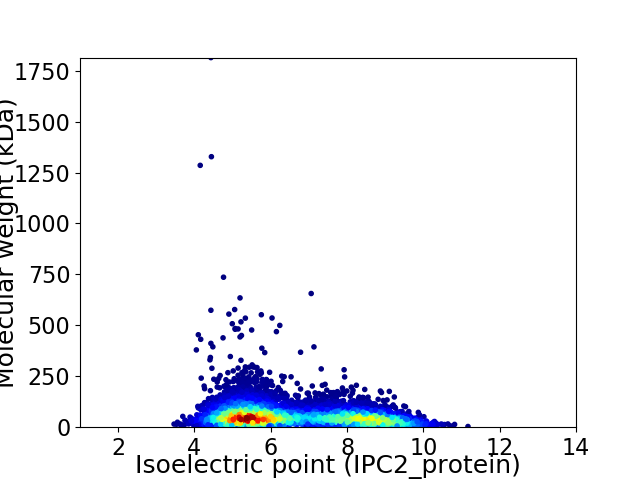
Virtual 2D-PAGE plot for 7886 proteins (isoelectric point calculated using IPC2_protein)
Get csv file with sequences according to given criteria:
* You can choose from 21 different methods for calculating isoelectric point
Summary statistics related to proteome-wise predictions


Protein with the lowest isoelectric point:
>tr|K8EBG6|K8EBG6_9CHLO Uncharacterized protein OS=Bathycoccus prasinos OX=41875 GN=Bathy02g00280 PE=4 SV=1
MM1 pKa = 7.44NEE3 pKa = 3.27VALWVGAACLFGAGIGFVQGVDD25 pKa = 3.0KK26 pKa = 11.03ASEE29 pKa = 4.17YY30 pKa = 10.29FAGYY34 pKa = 10.27LLEE37 pKa = 4.3QSLSVDD43 pKa = 3.17NLFVFILVFDD53 pKa = 3.94YY54 pKa = 10.82FKK56 pKa = 11.11VPEE59 pKa = 4.19STQPKK64 pKa = 7.79VLSYY68 pKa = 10.85GIVGAMIMRR77 pKa = 11.84AAMILAGATAIEE89 pKa = 4.54DD90 pKa = 4.02FEE92 pKa = 4.52PVLLVFAGILIFSSYY107 pKa = 10.92KK108 pKa = 10.35LLANNEE114 pKa = 4.07EE115 pKa = 4.33EE116 pKa = 4.36EE117 pKa = 4.39EE118 pKa = 4.13EE119 pKa = 4.16DD120 pKa = 4.23LKK122 pKa = 11.58DD123 pKa = 3.41SAIVKK128 pKa = 8.96FCSSMIQVSDD138 pKa = 4.37EE139 pKa = 4.02YY140 pKa = 11.42DD141 pKa = 3.37GDD143 pKa = 4.25NFWTTAKK150 pKa = 10.84DD151 pKa = 3.84GVTKK155 pKa = 10.23MATPLLLVVAVIEE168 pKa = 4.19LSDD171 pKa = 3.51VVFAVDD177 pKa = 4.69SIPAVFGVTKK187 pKa = 10.57DD188 pKa = 3.31PFIVYY193 pKa = 8.66TSNIFAICGLRR204 pKa = 11.84SLFGFVSAVVSEE216 pKa = 4.27LEE218 pKa = 3.9YY219 pKa = 11.25LEE221 pKa = 4.42TSVAVVLGFIGVKK234 pKa = 9.27MVADD238 pKa = 3.63YY239 pKa = 11.28AGYY242 pKa = 9.91PMSTEE247 pKa = 3.51ASLAVVATLLSGGVAASYY265 pKa = 9.33LFPSAPAEE273 pKa = 4.25VTSSVDD279 pKa = 3.23EE280 pKa = 4.27
MM1 pKa = 7.44NEE3 pKa = 3.27VALWVGAACLFGAGIGFVQGVDD25 pKa = 3.0KK26 pKa = 11.03ASEE29 pKa = 4.17YY30 pKa = 10.29FAGYY34 pKa = 10.27LLEE37 pKa = 4.3QSLSVDD43 pKa = 3.17NLFVFILVFDD53 pKa = 3.94YY54 pKa = 10.82FKK56 pKa = 11.11VPEE59 pKa = 4.19STQPKK64 pKa = 7.79VLSYY68 pKa = 10.85GIVGAMIMRR77 pKa = 11.84AAMILAGATAIEE89 pKa = 4.54DD90 pKa = 4.02FEE92 pKa = 4.52PVLLVFAGILIFSSYY107 pKa = 10.92KK108 pKa = 10.35LLANNEE114 pKa = 4.07EE115 pKa = 4.33EE116 pKa = 4.36EE117 pKa = 4.39EE118 pKa = 4.13EE119 pKa = 4.16DD120 pKa = 4.23LKK122 pKa = 11.58DD123 pKa = 3.41SAIVKK128 pKa = 8.96FCSSMIQVSDD138 pKa = 4.37EE139 pKa = 4.02YY140 pKa = 11.42DD141 pKa = 3.37GDD143 pKa = 4.25NFWTTAKK150 pKa = 10.84DD151 pKa = 3.84GVTKK155 pKa = 10.23MATPLLLVVAVIEE168 pKa = 4.19LSDD171 pKa = 3.51VVFAVDD177 pKa = 4.69SIPAVFGVTKK187 pKa = 10.57DD188 pKa = 3.31PFIVYY193 pKa = 8.66TSNIFAICGLRR204 pKa = 11.84SLFGFVSAVVSEE216 pKa = 4.27LEE218 pKa = 3.9YY219 pKa = 11.25LEE221 pKa = 4.42TSVAVVLGFIGVKK234 pKa = 9.27MVADD238 pKa = 3.63YY239 pKa = 11.28AGYY242 pKa = 9.91PMSTEE247 pKa = 3.51ASLAVVATLLSGGVAASYY265 pKa = 9.33LFPSAPAEE273 pKa = 4.25VTSSVDD279 pKa = 3.23EE280 pKa = 4.27
Molecular weight: 29.91 kDa
Isoelectric point according different methods:
Protein with the highest isoelectric point:
>tr|K8EWZ9|K8EWZ9_9CHLO Uncharacterized protein OS=Bathycoccus prasinos OX=41875 GN=Bathy06g04680 PE=4 SV=1
MM1 pKa = 7.1RR2 pKa = 11.84AKK4 pKa = 9.24WKK6 pKa = 10.27KK7 pKa = 9.75KK8 pKa = 6.4RR9 pKa = 11.84TRR11 pKa = 11.84RR12 pKa = 11.84LKK14 pKa = 9.73RR15 pKa = 11.84KK16 pKa = 7.81RR17 pKa = 11.84RR18 pKa = 11.84KK19 pKa = 8.8MRR21 pKa = 11.84MRR23 pKa = 11.84SKK25 pKa = 11.07
MM1 pKa = 7.1RR2 pKa = 11.84AKK4 pKa = 9.24WKK6 pKa = 10.27KK7 pKa = 9.75KK8 pKa = 6.4RR9 pKa = 11.84TRR11 pKa = 11.84RR12 pKa = 11.84LKK14 pKa = 9.73RR15 pKa = 11.84KK16 pKa = 7.81RR17 pKa = 11.84RR18 pKa = 11.84KK19 pKa = 8.8MRR21 pKa = 11.84MRR23 pKa = 11.84SKK25 pKa = 11.07
Molecular weight: 3.4 kDa
Isoelectric point according different methods:
Peptides (in silico digests for buttom-up proteomics)
Below you can find in silico digests of the whole proteome with Trypsin, Chymotrypsin, Trypsin+LysC, LysN, ArgC proteases suitable for different mass spec machines.| Try ESI |
 |
|---|
| ChTry ESI |
 |
|---|
| ArgC ESI |
 |
|---|
| LysN ESI |
 |
|---|
| TryLysC ESI |
 |
|---|
| Try MALDI |
 |
|---|
| ChTry MALDI |
 |
|---|
| ArgC MALDI |
 |
|---|
| LysN MALDI |
 |
|---|
| TryLysC MALDI |
 |
|---|
| Try LTQ |
 |
|---|
| ChTry LTQ |
 |
|---|
| ArgC LTQ |
 |
|---|
| LysN LTQ |
 |
|---|
| TryLysC LTQ |
 |
|---|
| Try MSlow |
 |
|---|
| ChTry MSlow |
 |
|---|
| ArgC MSlow |
 |
|---|
| LysN MSlow |
 |
|---|
| TryLysC MSlow |
 |
|---|
| Try MShigh |
 |
|---|
| ChTry MShigh |
 |
|---|
| ArgC MShigh |
 |
|---|
| LysN MShigh |
 |
|---|
| TryLysC MShigh |
 |
|---|
General Statistics
Number of major isoforms |
Number of additional isoforms |
Number of all proteins |
Number of amino acids |
Min. Seq. Length |
Max. Seq. Length |
Avg. Seq. Length |
Avg. Mol. Weight |
|---|---|---|---|---|---|---|---|
0 |
4117150 |
25 |
16310 |
522.1 |
58.15 |
Amino acid frequency
Ala |
Cys |
Asp |
Glu |
Phe |
Gly |
His |
Ile |
Lys |
Leu |
|---|---|---|---|---|---|---|---|---|---|
8.217 ± 0.031 | 1.59 ± 0.013 |
6.052 ± 0.024 | 8.439 ± 0.042 |
4.024 ± 0.02 | 6.459 ± 0.026 |
1.871 ± 0.013 | 4.217 ± 0.018 |
7.329 ± 0.039 | 7.839 ± 0.036 |
Met |
Asn |
Gln |
Pro |
Arg |
Ser |
Thr |
Val |
Trp |
Tyr |
|---|---|---|---|---|---|---|---|---|---|
2.356 ± 0.015 | 4.661 ± 0.019 |
3.806 ± 0.019 | 3.167 ± 0.019 |
6.133 ± 0.033 | 8.206 ± 0.045 |
5.718 ± 0.03 | 6.359 ± 0.023 |
1.068 ± 0.013 | 2.346 ± 0.017 |
Most of the basic statistics you can see at this page can be downloaded from this CSV file
Proteome-pI is available under Creative Commons Attribution-NoDerivs license, for more details see here
| Reference: Kozlowski LP. Proteome-pI 2.0: Proteome Isoelectric Point Database Update. Nucleic Acids Res. 2021, doi: 10.1093/nar/gkab944 | Contact: Lukasz P. Kozlowski |
