Clostridium sp. CAG:264
Taxonomy: cellular organisms; Bacteria; Terrabacteria group; Firmicutes; Clostridia; Eubacteriales; Clostridiaceae; Clostridium; environmental samples
Average proteome isoelectric point is 5.94
Get precalculated fractions of proteins

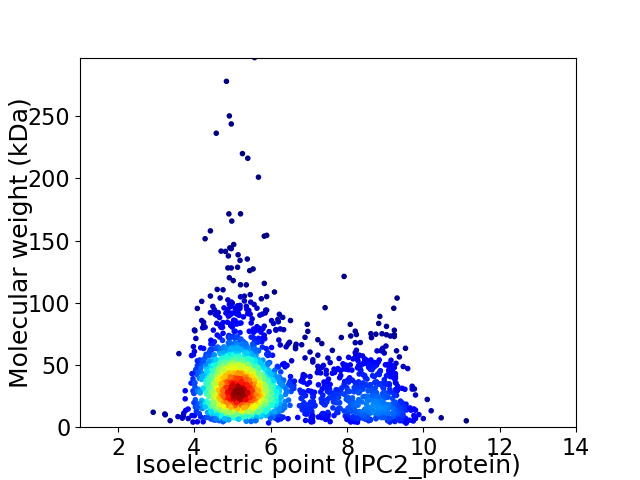
Virtual 2D-PAGE plot for 2136 proteins (isoelectric point calculated using IPC2_protein)
Get csv file with sequences according to given criteria:
* You can choose from 21 different methods for calculating isoelectric point
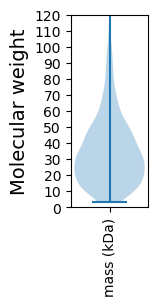
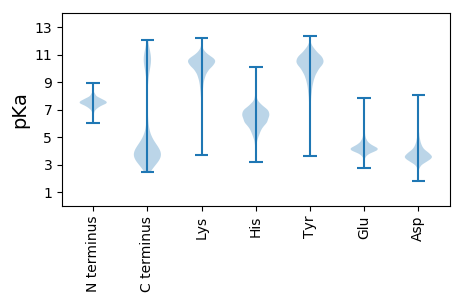
Summary statistics related to proteome-wise predictions


Protein with the lowest isoelectric point:
>tr|R5KGT4|R5KGT4_9CLOT MATE domain protein OS=Clostridium sp. CAG:264 OX=1262786 GN=BN572_01375 PE=4 SV=1
MM1 pKa = 7.54KK2 pKa = 10.18RR3 pKa = 11.84GHH5 pKa = 6.98CILAAGLCILAGLVSGCGDD24 pKa = 3.27KK25 pKa = 10.74KK26 pKa = 10.52QQTSEE31 pKa = 4.38EE32 pKa = 4.11ITTAEE37 pKa = 4.54DD38 pKa = 3.33GTVAVEE44 pKa = 4.74VLDD47 pKa = 3.94NDD49 pKa = 4.65QIALVYY55 pKa = 10.43NGYY58 pKa = 10.44DD59 pKa = 3.67PEE61 pKa = 4.34VHH63 pKa = 6.78GMMFTITNKK72 pKa = 10.07SDD74 pKa = 3.27DD75 pKa = 3.6QMVNVYY81 pKa = 10.16FSDD84 pKa = 3.82VVVDD88 pKa = 5.18GEE90 pKa = 4.54TLQPMFGLDD99 pKa = 3.36VEE101 pKa = 4.69AQTSEE106 pKa = 4.2DD107 pKa = 3.83QICLVDD113 pKa = 4.85CDD115 pKa = 4.31AAPAALTGIVCVDD128 pKa = 3.46DD129 pKa = 3.71MEE131 pKa = 6.43GYY133 pKa = 9.08TIGTYY138 pKa = 10.24EE139 pKa = 4.28IDD141 pKa = 5.2DD142 pKa = 3.75VALSNEE148 pKa = 3.82KK149 pKa = 10.61DD150 pKa = 3.35DD151 pKa = 3.94TKK153 pKa = 11.13EE154 pKa = 3.86YY155 pKa = 9.31TVKK158 pKa = 10.58EE159 pKa = 4.09GAVTILDD166 pKa = 3.66NDD168 pKa = 3.93KK169 pKa = 10.0VTVSYY174 pKa = 10.7IGIEE178 pKa = 3.99NDD180 pKa = 3.11SDD182 pKa = 4.22GDD184 pKa = 3.83DD185 pKa = 4.05AEE187 pKa = 4.23QVLAFEE193 pKa = 5.44VYY195 pKa = 10.58NKK197 pKa = 9.02TDD199 pKa = 3.2KK200 pKa = 10.9KK201 pKa = 10.47IQATFDD207 pKa = 3.5TVLVNGKK214 pKa = 7.98EE215 pKa = 4.0EE216 pKa = 4.41EE217 pKa = 3.87ISYY220 pKa = 10.7VADD223 pKa = 3.86AMGHH227 pKa = 5.56TYY229 pKa = 9.2ATLFCDD235 pKa = 3.74VSDD238 pKa = 4.12VKK240 pKa = 11.57AMTTLTGEE248 pKa = 4.01FTVYY252 pKa = 10.88DD253 pKa = 4.47EE254 pKa = 5.35DD255 pKa = 5.53DD256 pKa = 3.9EE257 pKa = 6.27LIGSYY262 pKa = 10.28SIEE265 pKa = 4.1KK266 pKa = 10.29AALKK270 pKa = 10.48
MM1 pKa = 7.54KK2 pKa = 10.18RR3 pKa = 11.84GHH5 pKa = 6.98CILAAGLCILAGLVSGCGDD24 pKa = 3.27KK25 pKa = 10.74KK26 pKa = 10.52QQTSEE31 pKa = 4.38EE32 pKa = 4.11ITTAEE37 pKa = 4.54DD38 pKa = 3.33GTVAVEE44 pKa = 4.74VLDD47 pKa = 3.94NDD49 pKa = 4.65QIALVYY55 pKa = 10.43NGYY58 pKa = 10.44DD59 pKa = 3.67PEE61 pKa = 4.34VHH63 pKa = 6.78GMMFTITNKK72 pKa = 10.07SDD74 pKa = 3.27DD75 pKa = 3.6QMVNVYY81 pKa = 10.16FSDD84 pKa = 3.82VVVDD88 pKa = 5.18GEE90 pKa = 4.54TLQPMFGLDD99 pKa = 3.36VEE101 pKa = 4.69AQTSEE106 pKa = 4.2DD107 pKa = 3.83QICLVDD113 pKa = 4.85CDD115 pKa = 4.31AAPAALTGIVCVDD128 pKa = 3.46DD129 pKa = 3.71MEE131 pKa = 6.43GYY133 pKa = 9.08TIGTYY138 pKa = 10.24EE139 pKa = 4.28IDD141 pKa = 5.2DD142 pKa = 3.75VALSNEE148 pKa = 3.82KK149 pKa = 10.61DD150 pKa = 3.35DD151 pKa = 3.94TKK153 pKa = 11.13EE154 pKa = 3.86YY155 pKa = 9.31TVKK158 pKa = 10.58EE159 pKa = 4.09GAVTILDD166 pKa = 3.66NDD168 pKa = 3.93KK169 pKa = 10.0VTVSYY174 pKa = 10.7IGIEE178 pKa = 3.99NDD180 pKa = 3.11SDD182 pKa = 4.22GDD184 pKa = 3.83DD185 pKa = 4.05AEE187 pKa = 4.23QVLAFEE193 pKa = 5.44VYY195 pKa = 10.58NKK197 pKa = 9.02TDD199 pKa = 3.2KK200 pKa = 10.9KK201 pKa = 10.47IQATFDD207 pKa = 3.5TVLVNGKK214 pKa = 7.98EE215 pKa = 4.0EE216 pKa = 4.41EE217 pKa = 3.87ISYY220 pKa = 10.7VADD223 pKa = 3.86AMGHH227 pKa = 5.56TYY229 pKa = 9.2ATLFCDD235 pKa = 3.74VSDD238 pKa = 4.12VKK240 pKa = 11.57AMTTLTGEE248 pKa = 4.01FTVYY252 pKa = 10.88DD253 pKa = 4.47EE254 pKa = 5.35DD255 pKa = 5.53DD256 pKa = 3.9EE257 pKa = 6.27LIGSYY262 pKa = 10.28SIEE265 pKa = 4.1KK266 pKa = 10.29AALKK270 pKa = 10.48
Molecular weight: 29.31 kDa
Isoelectric point according different methods:
Protein with the highest isoelectric point:
>tr|R5K4X7|R5K4X7_9CLOT DNA helicase OS=Clostridium sp. CAG:264 OX=1262786 GN=BN572_00987 PE=4 SV=1
MM1 pKa = 7.67KK2 pKa = 8.72MTFQPKK8 pKa = 8.95KK9 pKa = 7.58RR10 pKa = 11.84QRR12 pKa = 11.84SKK14 pKa = 9.07VHH16 pKa = 5.95GFRR19 pKa = 11.84KK20 pKa = 10.0RR21 pKa = 11.84MSTANGRR28 pKa = 11.84KK29 pKa = 8.89VLAARR34 pKa = 11.84RR35 pKa = 11.84AKK37 pKa = 10.1GRR39 pKa = 11.84KK40 pKa = 8.83KK41 pKa = 10.63LSAA44 pKa = 3.95
MM1 pKa = 7.67KK2 pKa = 8.72MTFQPKK8 pKa = 8.95KK9 pKa = 7.58RR10 pKa = 11.84QRR12 pKa = 11.84SKK14 pKa = 9.07VHH16 pKa = 5.95GFRR19 pKa = 11.84KK20 pKa = 10.0RR21 pKa = 11.84MSTANGRR28 pKa = 11.84KK29 pKa = 8.89VLAARR34 pKa = 11.84RR35 pKa = 11.84AKK37 pKa = 10.1GRR39 pKa = 11.84KK40 pKa = 8.83KK41 pKa = 10.63LSAA44 pKa = 3.95
Molecular weight: 5.13 kDa
Isoelectric point according different methods:
Peptides (in silico digests for buttom-up proteomics)
Below you can find in silico digests of the whole proteome with Trypsin, Chymotrypsin, Trypsin+LysC, LysN, ArgC proteases suitable for different mass spec machines.| Try ESI |
 |
|---|
| ChTry ESI |
 |
|---|
| ArgC ESI |
 |
|---|
| LysN ESI |
 |
|---|
| TryLysC ESI |
 |
|---|
| Try MALDI |
 |
|---|
| ChTry MALDI |
 |
|---|
| ArgC MALDI |
 |
|---|
| LysN MALDI |
 |
|---|
| TryLysC MALDI |
 |
|---|
| Try LTQ |
 |
|---|
| ChTry LTQ |
 |
|---|
| ArgC LTQ |
 |
|---|
| LysN LTQ |
 |
|---|
| TryLysC LTQ |
 |
|---|
| Try MSlow |
 |
|---|
| ChTry MSlow |
 |
|---|
| ArgC MSlow |
 |
|---|
| LysN MSlow |
 |
|---|
| TryLysC MSlow |
 |
|---|
| Try MShigh |
 |
|---|
| ChTry MShigh |
 |
|---|
| ArgC MShigh |
 |
|---|
| LysN MShigh |
 |
|---|
| TryLysC MShigh |
 |
|---|
General Statistics
Number of major isoforms |
Number of additional isoforms |
Number of all proteins |
Number of amino acids |
Min. Seq. Length |
Max. Seq. Length |
Avg. Seq. Length |
Avg. Mol. Weight |
|---|---|---|---|---|---|---|---|
0 |
706887 |
30 |
2768 |
330.9 |
37.09 |
Amino acid frequency
Ala |
Cys |
Asp |
Glu |
Phe |
Gly |
His |
Ile |
Lys |
Leu |
|---|---|---|---|---|---|---|---|---|---|
7.411 ± 0.053 | 1.472 ± 0.022 |
6.273 ± 0.049 | 7.237 ± 0.063 |
3.931 ± 0.046 | 6.942 ± 0.058 |
1.676 ± 0.024 | 7.832 ± 0.05 |
7.265 ± 0.053 | 8.341 ± 0.06 |
Met |
Asn |
Gln |
Pro |
Arg |
Ser |
Thr |
Val |
Trp |
Tyr |
|---|---|---|---|---|---|---|---|---|---|
3.132 ± 0.033 | 4.627 ± 0.037 |
3.027 ± 0.029 | 2.926 ± 0.023 |
4.02 ± 0.037 | 5.788 ± 0.048 |
5.765 ± 0.061 | 7.046 ± 0.039 |
0.783 ± 0.017 | 4.507 ± 0.043 |
Most of the basic statistics you can see at this page can be downloaded from this CSV file
Proteome-pI is available under Creative Commons Attribution-NoDerivs license, for more details see here
| Reference: Kozlowski LP. Proteome-pI 2.0: Proteome Isoelectric Point Database Update. Nucleic Acids Res. 2021, doi: 10.1093/nar/gkab944 | Contact: Lukasz P. Kozlowski |
