Laodelphax striatellus (Small brown planthopper) (Delphax striatella)
Taxonomy: cellular organisms; Eukaryota; Opisthokonta; Metazoa; Eumetazoa; Bilateria; Protostomia; Ecdysozoa; Panarthropoda; Arthropoda; Mandibulata; Pancrustacea; Hexapoda; Insecta; Dicondylia; Pterygota; Neoptera; Paraneoptera; Hemiptera; Auchenorrhyncha; Fulgoromorpha; Fulgoroidea;
Average proteome isoelectric point is 6.81
Get precalculated fractions of proteins

Virtual 2D-PAGE plot for 17309 proteins (isoelectric point calculated using IPC2_protein)
Get csv file with sequences according to given criteria:
* You can choose from 21 different methods for calculating isoelectric point
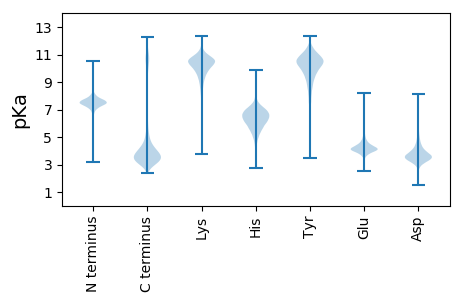
Summary statistics related to proteome-wise predictions


Protein with the lowest isoelectric point:
>tr|A0A482X7B0|A0A482X7B0_LAOST Ubiquitin-like modifier-activating enzyme 5 OS=Laodelphax striatellus OX=195883 GN=LSTR_LSTR000291 PE=3 SV=1
MM1 pKa = 6.88NQSTHH6 pKa = 6.14SNEE9 pKa = 4.25NKK11 pKa = 9.48HH12 pKa = 4.83STFVFHH18 pKa = 7.42EE19 pKa = 4.25IEE21 pKa = 4.01NDD23 pKa = 3.14IQATLDD29 pKa = 3.65DD30 pKa = 4.23VMMEE34 pKa = 4.3VPQVDD39 pKa = 3.73IAVGDD44 pKa = 3.72YY45 pKa = 9.62GTFTEE50 pKa = 4.2QQNDD54 pKa = 3.58VSVMISPTVPFTVSHH69 pKa = 7.48PSTEE73 pKa = 4.31SPPTQVDD80 pKa = 3.53MAIEE84 pKa = 4.71DD85 pKa = 4.45YY86 pKa = 7.93EE87 pKa = 4.51TSTEE91 pKa = 4.02QQNDD95 pKa = 3.85LSVMISPTVPFTVSRR110 pKa = 11.84PSTEE114 pKa = 3.99SPPIDD119 pKa = 3.53TVHH122 pKa = 6.8SYY124 pKa = 8.6TVEE127 pKa = 4.1TSSTSYY133 pKa = 10.82EE134 pKa = 4.05LQNTNLVADD143 pKa = 4.67LPIIFDD149 pKa = 3.62FDD151 pKa = 4.48LPVHH155 pKa = 6.07VAAEE159 pKa = 4.07PP160 pKa = 3.33
MM1 pKa = 6.88NQSTHH6 pKa = 6.14SNEE9 pKa = 4.25NKK11 pKa = 9.48HH12 pKa = 4.83STFVFHH18 pKa = 7.42EE19 pKa = 4.25IEE21 pKa = 4.01NDD23 pKa = 3.14IQATLDD29 pKa = 3.65DD30 pKa = 4.23VMMEE34 pKa = 4.3VPQVDD39 pKa = 3.73IAVGDD44 pKa = 3.72YY45 pKa = 9.62GTFTEE50 pKa = 4.2QQNDD54 pKa = 3.58VSVMISPTVPFTVSHH69 pKa = 7.48PSTEE73 pKa = 4.31SPPTQVDD80 pKa = 3.53MAIEE84 pKa = 4.71DD85 pKa = 4.45YY86 pKa = 7.93EE87 pKa = 4.51TSTEE91 pKa = 4.02QQNDD95 pKa = 3.85LSVMISPTVPFTVSRR110 pKa = 11.84PSTEE114 pKa = 3.99SPPIDD119 pKa = 3.53TVHH122 pKa = 6.8SYY124 pKa = 8.6TVEE127 pKa = 4.1TSSTSYY133 pKa = 10.82EE134 pKa = 4.05LQNTNLVADD143 pKa = 4.67LPIIFDD149 pKa = 3.62FDD151 pKa = 4.48LPVHH155 pKa = 6.07VAAEE159 pKa = 4.07PP160 pKa = 3.33
Molecular weight: 17.71 kDa
Isoelectric point according different methods:
Protein with the highest isoelectric point:
>tr|A0A482XIY8|A0A482XIY8_LAOST Uncharacterized protein (Fragment) OS=Laodelphax striatellus OX=195883 GN=LSTR_LSTR017292 PE=4 SV=1
SS1 pKa = 6.8SSRR4 pKa = 11.84SSRR7 pKa = 11.84SSRR10 pKa = 11.84PGSSSRR16 pKa = 11.84SRR18 pKa = 11.84LPRR21 pKa = 11.84SSRR24 pKa = 11.84SSRR27 pKa = 11.84SVGSSRR33 pKa = 11.84SSRR36 pKa = 11.84VLLFKK41 pKa = 10.59QRR43 pKa = 11.84SHH45 pKa = 5.67QSPRR49 pKa = 11.84QGEE52 pKa = 4.08GRR54 pKa = 11.84LRR56 pKa = 11.84SRR58 pKa = 11.84APRR61 pKa = 11.84GSRR64 pKa = 11.84TGLPRR69 pKa = 11.84TVGRR73 pKa = 11.84SRR75 pKa = 11.84CSRR78 pKa = 11.84LRR80 pKa = 11.84IALRR84 pKa = 11.84SLLLSLGQLPP94 pKa = 3.84
SS1 pKa = 6.8SSRR4 pKa = 11.84SSRR7 pKa = 11.84SSRR10 pKa = 11.84PGSSSRR16 pKa = 11.84SRR18 pKa = 11.84LPRR21 pKa = 11.84SSRR24 pKa = 11.84SSRR27 pKa = 11.84SVGSSRR33 pKa = 11.84SSRR36 pKa = 11.84VLLFKK41 pKa = 10.59QRR43 pKa = 11.84SHH45 pKa = 5.67QSPRR49 pKa = 11.84QGEE52 pKa = 4.08GRR54 pKa = 11.84LRR56 pKa = 11.84SRR58 pKa = 11.84APRR61 pKa = 11.84GSRR64 pKa = 11.84TGLPRR69 pKa = 11.84TVGRR73 pKa = 11.84SRR75 pKa = 11.84CSRR78 pKa = 11.84LRR80 pKa = 11.84IALRR84 pKa = 11.84SLLLSLGQLPP94 pKa = 3.84
Molecular weight: 10.36 kDa
Isoelectric point according different methods:
Peptides (in silico digests for buttom-up proteomics)
Below you can find in silico digests of the whole proteome with Trypsin, Chymotrypsin, Trypsin+LysC, LysN, ArgC proteases suitable for different mass spec machines.| Try ESI |
 |
|---|
| ChTry ESI |
 |
|---|
| ArgC ESI |
 |
|---|
| LysN ESI |
 |
|---|
| TryLysC ESI |
 |
|---|
| Try MALDI |
 |
|---|
| ChTry MALDI |
 |
|---|
| ArgC MALDI |
 |
|---|
| LysN MALDI |
 |
|---|
| TryLysC MALDI |
 |
|---|
| Try LTQ |
 |
|---|
| ChTry LTQ |
 |
|---|
| ArgC LTQ |
 |
|---|
| LysN LTQ |
 |
|---|
| TryLysC LTQ |
 |
|---|
| Try MSlow |
 |
|---|
| ChTry MSlow |
 |
|---|
| ArgC MSlow |
 |
|---|
| LysN MSlow |
 |
|---|
| TryLysC MSlow |
 |
|---|
| Try MShigh |
 |
|---|
| ChTry MShigh |
 |
|---|
| ArgC MShigh |
 |
|---|
| LysN MShigh |
 |
|---|
| TryLysC MShigh |
 |
|---|
General Statistics
Number of major isoforms |
Number of additional isoforms |
Number of all proteins |
Number of amino acids |
Min. Seq. Length |
Max. Seq. Length |
Avg. Seq. Length |
Avg. Mol. Weight |
|---|---|---|---|---|---|---|---|
0 |
7449579 |
49 |
13617 |
430.4 |
48.25 |
Amino acid frequency
Ala |
Cys |
Asp |
Glu |
Phe |
Gly |
His |
Ile |
Lys |
Leu |
|---|---|---|---|---|---|---|---|---|---|
6.324 ± 0.022 | 2.045 ± 0.019 |
5.517 ± 0.019 | 6.803 ± 0.03 |
3.747 ± 0.017 | 5.814 ± 0.026 |
2.513 ± 0.013 | 5.123 ± 0.018 |
6.477 ± 0.026 | 9.002 ± 0.029 |
Met |
Asn |
Gln |
Pro |
Arg |
Ser |
Thr |
Val |
Trp |
Tyr |
|---|---|---|---|---|---|---|---|---|---|
2.326 ± 0.012 | 4.882 ± 0.018 |
5.235 ± 0.027 | 4.207 ± 0.02 |
5.421 ± 0.019 | 8.707 ± 0.03 |
5.601 ± 0.016 | 6.271 ± 0.015 |
1.068 ± 0.008 | 2.915 ± 0.014 |
Most of the basic statistics you can see at this page can be downloaded from this CSV file
Proteome-pI is available under Creative Commons Attribution-NoDerivs license, for more details see here
| Reference: Kozlowski LP. Proteome-pI 2.0: Proteome Isoelectric Point Database Update. Nucleic Acids Res. 2021, doi: 10.1093/nar/gkab944 | Contact: Lukasz P. Kozlowski |
