Paracoccus isoporae
Taxonomy: cellular organisms; Bacteria; Proteobacteria; Alphaproteobacteria; Rhodobacterales; Rhodobacteraceae; Paracoccus
Average proteome isoelectric point is 6.19
Get precalculated fractions of proteins

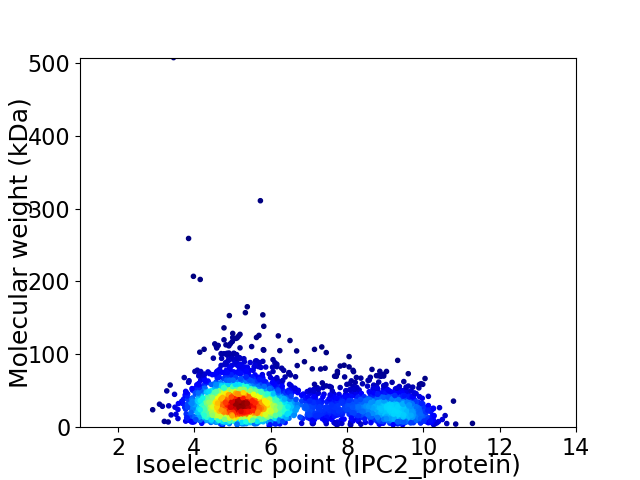
Virtual 2D-PAGE plot for 3345 proteins (isoelectric point calculated using IPC2_protein)
Get csv file with sequences according to given criteria:
* You can choose from 21 different methods for calculating isoelectric point
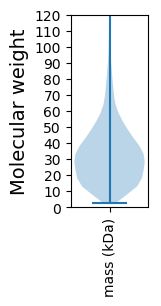
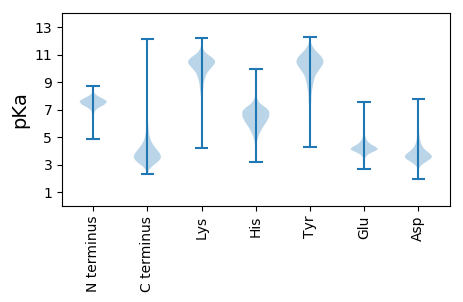
Summary statistics related to proteome-wise predictions


Protein with the lowest isoelectric point:
>tr|A0A1G6WDD2|A0A1G6WDD2_9RHOB N-(5'-phosphoribosyl)anthranilate isomerase OS=Paracoccus isoporae OX=591205 GN=trpF PE=3 SV=1
MM1 pKa = 8.1RR2 pKa = 11.84ITTGICGLLAAAMLSGGAALAQTEE26 pKa = 4.34DD27 pKa = 3.66AEE29 pKa = 4.48AAASDD34 pKa = 3.81MPEE37 pKa = 4.39AEE39 pKa = 4.41SVTTDD44 pKa = 2.59SDD46 pKa = 3.77GAAGQDD52 pKa = 3.45ATGSMSGTDD61 pKa = 3.23TDD63 pKa = 4.56ADD65 pKa = 4.21PGTMSGSDD73 pKa = 3.05TGADD77 pKa = 3.37SGAMSGSDD85 pKa = 3.13TAEE88 pKa = 4.12TEE90 pKa = 4.17PGGAAAGMGTDD101 pKa = 3.79AAPAHH106 pKa = 6.47SATISDD112 pKa = 4.29AEE114 pKa = 4.38GAQIGAVEE122 pKa = 4.5LSFSASGLAVVDD134 pKa = 3.92ISFTGVPAGEE144 pKa = 4.4HH145 pKa = 5.8AVHH148 pKa = 6.51FHH150 pKa = 4.32QTGMCEE156 pKa = 4.08APFDD160 pKa = 4.17SAGDD164 pKa = 3.89HH165 pKa = 6.58LAGDD169 pKa = 3.94MDD171 pKa = 4.83HH172 pKa = 7.24GVMAQNGPHH181 pKa = 7.07PGDD184 pKa = 3.56MPNITVPDD192 pKa = 3.64SGEE195 pKa = 3.54ISLTYY200 pKa = 9.08FVPGLTEE207 pKa = 5.28DD208 pKa = 5.12LVADD212 pKa = 4.35DD213 pKa = 5.64DD214 pKa = 4.17GTAFVIHH221 pKa = 6.49EE222 pKa = 4.52ASDD225 pKa = 3.95DD226 pKa = 3.84YY227 pKa = 11.34RR228 pKa = 11.84SQPSGDD234 pKa = 2.94AGGRR238 pKa = 11.84LGCAVVTEE246 pKa = 4.42AAGG249 pKa = 3.24
MM1 pKa = 8.1RR2 pKa = 11.84ITTGICGLLAAAMLSGGAALAQTEE26 pKa = 4.34DD27 pKa = 3.66AEE29 pKa = 4.48AAASDD34 pKa = 3.81MPEE37 pKa = 4.39AEE39 pKa = 4.41SVTTDD44 pKa = 2.59SDD46 pKa = 3.77GAAGQDD52 pKa = 3.45ATGSMSGTDD61 pKa = 3.23TDD63 pKa = 4.56ADD65 pKa = 4.21PGTMSGSDD73 pKa = 3.05TGADD77 pKa = 3.37SGAMSGSDD85 pKa = 3.13TAEE88 pKa = 4.12TEE90 pKa = 4.17PGGAAAGMGTDD101 pKa = 3.79AAPAHH106 pKa = 6.47SATISDD112 pKa = 4.29AEE114 pKa = 4.38GAQIGAVEE122 pKa = 4.5LSFSASGLAVVDD134 pKa = 3.92ISFTGVPAGEE144 pKa = 4.4HH145 pKa = 5.8AVHH148 pKa = 6.51FHH150 pKa = 4.32QTGMCEE156 pKa = 4.08APFDD160 pKa = 4.17SAGDD164 pKa = 3.89HH165 pKa = 6.58LAGDD169 pKa = 3.94MDD171 pKa = 4.83HH172 pKa = 7.24GVMAQNGPHH181 pKa = 7.07PGDD184 pKa = 3.56MPNITVPDD192 pKa = 3.64SGEE195 pKa = 3.54ISLTYY200 pKa = 9.08FVPGLTEE207 pKa = 5.28DD208 pKa = 5.12LVADD212 pKa = 4.35DD213 pKa = 5.64DD214 pKa = 4.17GTAFVIHH221 pKa = 6.49EE222 pKa = 4.52ASDD225 pKa = 3.95DD226 pKa = 3.84YY227 pKa = 11.34RR228 pKa = 11.84SQPSGDD234 pKa = 2.94AGGRR238 pKa = 11.84LGCAVVTEE246 pKa = 4.42AAGG249 pKa = 3.24
Molecular weight: 24.3 kDa
Isoelectric point according different methods:
Protein with the highest isoelectric point:
>tr|A0A1G7GFW0|A0A1G7GFW0_9RHOB Solute:Na+ symporter SSS family OS=Paracoccus isoporae OX=591205 GN=SAMN05421538_11336 PE=3 SV=1
MM1 pKa = 7.69SKK3 pKa = 9.01RR4 pKa = 11.84TFQPSNLVRR13 pKa = 11.84TRR15 pKa = 11.84RR16 pKa = 11.84HH17 pKa = 4.63GFRR20 pKa = 11.84ARR22 pKa = 11.84MATKK26 pKa = 10.39AGRR29 pKa = 11.84AVLNRR34 pKa = 11.84RR35 pKa = 11.84RR36 pKa = 11.84AKK38 pKa = 9.7GRR40 pKa = 11.84KK41 pKa = 8.85RR42 pKa = 11.84LSAA45 pKa = 3.96
MM1 pKa = 7.69SKK3 pKa = 9.01RR4 pKa = 11.84TFQPSNLVRR13 pKa = 11.84TRR15 pKa = 11.84RR16 pKa = 11.84HH17 pKa = 4.63GFRR20 pKa = 11.84ARR22 pKa = 11.84MATKK26 pKa = 10.39AGRR29 pKa = 11.84AVLNRR34 pKa = 11.84RR35 pKa = 11.84RR36 pKa = 11.84AKK38 pKa = 9.7GRR40 pKa = 11.84KK41 pKa = 8.85RR42 pKa = 11.84LSAA45 pKa = 3.96
Molecular weight: 5.25 kDa
Isoelectric point according different methods:
Peptides (in silico digests for buttom-up proteomics)
Below you can find in silico digests of the whole proteome with Trypsin, Chymotrypsin, Trypsin+LysC, LysN, ArgC proteases suitable for different mass spec machines.| Try ESI |
 |
|---|
| ChTry ESI |
 |
|---|
| ArgC ESI |
 |
|---|
| LysN ESI |
 |
|---|
| TryLysC ESI |
 |
|---|
| Try MALDI |
 |
|---|
| ChTry MALDI |
 |
|---|
| ArgC MALDI |
 |
|---|
| LysN MALDI |
 |
|---|
| TryLysC MALDI |
 |
|---|
| Try LTQ |
 |
|---|
| ChTry LTQ |
 |
|---|
| ArgC LTQ |
 |
|---|
| LysN LTQ |
 |
|---|
| TryLysC LTQ |
 |
|---|
| Try MSlow |
 |
|---|
| ChTry MSlow |
 |
|---|
| ArgC MSlow |
 |
|---|
| LysN MSlow |
 |
|---|
| TryLysC MSlow |
 |
|---|
| Try MShigh |
 |
|---|
| ChTry MShigh |
 |
|---|
| ArgC MShigh |
 |
|---|
| LysN MShigh |
 |
|---|
| TryLysC MShigh |
 |
|---|
General Statistics
Number of major isoforms |
Number of additional isoforms |
Number of all proteins |
Number of amino acids |
Min. Seq. Length |
Max. Seq. Length |
Avg. Seq. Length |
Avg. Mol. Weight |
|---|---|---|---|---|---|---|---|
0 |
1059547 |
26 |
4924 |
316.8 |
34.29 |
Amino acid frequency
Ala |
Cys |
Asp |
Glu |
Phe |
Gly |
His |
Ile |
Lys |
Leu |
|---|---|---|---|---|---|---|---|---|---|
12.998 ± 0.061 | 0.792 ± 0.013 |
6.318 ± 0.038 | 5.847 ± 0.038 |
3.526 ± 0.028 | 9.002 ± 0.046 |
1.971 ± 0.024 | 5.208 ± 0.033 |
2.526 ± 0.036 | 10.034 ± 0.051 |
Met |
Asn |
Gln |
Pro |
Arg |
Ser |
Thr |
Val |
Trp |
Tyr |
|---|---|---|---|---|---|---|---|---|---|
2.828 ± 0.021 | 2.413 ± 0.026 |
5.293 ± 0.033 | 3.25 ± 0.025 |
7.421 ± 0.057 | 5.109 ± 0.028 |
5.064 ± 0.034 | 6.898 ± 0.035 |
1.398 ± 0.02 | 2.104 ± 0.019 |
Most of the basic statistics you can see at this page can be downloaded from this CSV file
Proteome-pI is available under Creative Commons Attribution-NoDerivs license, for more details see here
| Reference: Kozlowski LP. Proteome-pI 2.0: Proteome Isoelectric Point Database Update. Nucleic Acids Res. 2021, doi: 10.1093/nar/gkab944 | Contact: Lukasz P. Kozlowski |
