Angelonia flower break virus
Taxonomy: Viruses; Riboviria; Orthornavirae; Kitrinoviricota; Tolucaviricetes; Tolivirales; Tombusviridae; Procedovirinae; Alphacarmovirus
Average proteome isoelectric point is 8.09
Get precalculated fractions of proteins

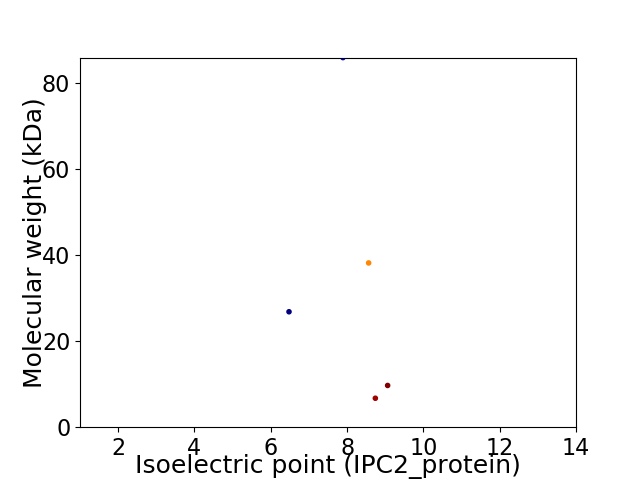
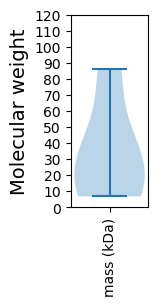
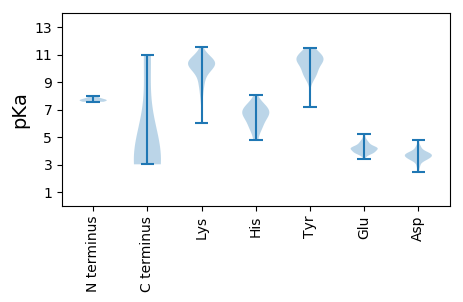
Virtual 2D-PAGE plot for 5 proteins (isoelectric point calculated using IPC2_protein)
Get csv file with sequences according to given criteria:
* You can choose from 21 different methods for calculating isoelectric point
Summary statistics related to proteome-wise predictions


Protein with the lowest isoelectric point:
>tr|Q2Q474|Q2Q474_9TOMB RNA-directed RNA polymerase OS=Angelonia flower break virus OX=352882 GN=p86 PE=4 SV=2
MM1 pKa = 7.68GFFRR5 pKa = 11.84DD6 pKa = 3.77VLKK9 pKa = 11.15CGAQNAIGCTLITGAVAVGIAALEE33 pKa = 3.86VRR35 pKa = 11.84AAIGAYY41 pKa = 9.76EE42 pKa = 3.92FTNYY46 pKa = 10.64ALHH49 pKa = 6.37TSIDD53 pKa = 3.87YY54 pKa = 10.58IRR56 pKa = 11.84TRR58 pKa = 11.84GEE60 pKa = 3.72SLQPVPQYY68 pKa = 10.88PSDD71 pKa = 3.71NTSEE75 pKa = 4.18AFGVDD80 pKa = 3.65LVSEE84 pKa = 4.28EE85 pKa = 4.79SNLSDD90 pKa = 4.31HH91 pKa = 7.2LDD93 pKa = 4.11TIPEE97 pKa = 4.09EE98 pKa = 4.27TDD100 pKa = 2.87GSKK103 pKa = 10.43VVRR106 pKa = 11.84PARR109 pKa = 11.84AIIRR113 pKa = 11.84RR114 pKa = 11.84HH115 pKa = 4.78ARR117 pKa = 11.84GKK119 pKa = 10.45FSYY122 pKa = 9.68CLAMAAKK129 pKa = 9.56NAFGGTPTNTKK140 pKa = 9.68ANQMSVMRR148 pKa = 11.84FMVGKK153 pKa = 10.1CGEE156 pKa = 4.17HH157 pKa = 6.69HH158 pKa = 6.65LTDD161 pKa = 3.66ASARR165 pKa = 11.84VACAEE170 pKa = 3.86AMSVCFTPDD179 pKa = 2.48ISEE182 pKa = 3.83INMFKK187 pKa = 10.78GLNSHH192 pKa = 7.08AAYY195 pKa = 10.53LRR197 pKa = 11.84TAALRR202 pKa = 11.84EE203 pKa = 4.24AKK205 pKa = 10.16RR206 pKa = 11.84VDD208 pKa = 3.47CWWYY212 pKa = 11.12NLLLHH217 pKa = 6.84PLAANAWQRR226 pKa = 11.84AWMVLNRR233 pKa = 11.84LGDD236 pKa = 3.7LEE238 pKa = 4.16AFEE241 pKa = 5.12FIKK244 pKa = 10.95
MM1 pKa = 7.68GFFRR5 pKa = 11.84DD6 pKa = 3.77VLKK9 pKa = 11.15CGAQNAIGCTLITGAVAVGIAALEE33 pKa = 3.86VRR35 pKa = 11.84AAIGAYY41 pKa = 9.76EE42 pKa = 3.92FTNYY46 pKa = 10.64ALHH49 pKa = 6.37TSIDD53 pKa = 3.87YY54 pKa = 10.58IRR56 pKa = 11.84TRR58 pKa = 11.84GEE60 pKa = 3.72SLQPVPQYY68 pKa = 10.88PSDD71 pKa = 3.71NTSEE75 pKa = 4.18AFGVDD80 pKa = 3.65LVSEE84 pKa = 4.28EE85 pKa = 4.79SNLSDD90 pKa = 4.31HH91 pKa = 7.2LDD93 pKa = 4.11TIPEE97 pKa = 4.09EE98 pKa = 4.27TDD100 pKa = 2.87GSKK103 pKa = 10.43VVRR106 pKa = 11.84PARR109 pKa = 11.84AIIRR113 pKa = 11.84RR114 pKa = 11.84HH115 pKa = 4.78ARR117 pKa = 11.84GKK119 pKa = 10.45FSYY122 pKa = 9.68CLAMAAKK129 pKa = 9.56NAFGGTPTNTKK140 pKa = 9.68ANQMSVMRR148 pKa = 11.84FMVGKK153 pKa = 10.1CGEE156 pKa = 4.17HH157 pKa = 6.69HH158 pKa = 6.65LTDD161 pKa = 3.66ASARR165 pKa = 11.84VACAEE170 pKa = 3.86AMSVCFTPDD179 pKa = 2.48ISEE182 pKa = 3.83INMFKK187 pKa = 10.78GLNSHH192 pKa = 7.08AAYY195 pKa = 10.53LRR197 pKa = 11.84TAALRR202 pKa = 11.84EE203 pKa = 4.24AKK205 pKa = 10.16RR206 pKa = 11.84VDD208 pKa = 3.47CWWYY212 pKa = 11.12NLLLHH217 pKa = 6.84PLAANAWQRR226 pKa = 11.84AWMVLNRR233 pKa = 11.84LGDD236 pKa = 3.7LEE238 pKa = 4.16AFEE241 pKa = 5.12FIKK244 pKa = 10.95
Molecular weight: 26.84 kDa
Isoelectric point according different methods:
Protein with the highest isoelectric point:
>tr|Q2Q472|Q2Q472_9TOMB p7 OS=Angelonia flower break virus OX=352882 GN=p7 PE=4 SV=1
MM1 pKa = 7.73LSANLNLTVLSGVIGLLLLTRR22 pKa = 11.84STLNLPSIYY31 pKa = 10.52DD32 pKa = 3.82LVPFSLPRR40 pKa = 11.84LVKK43 pKa = 10.13LDD45 pKa = 3.72QIIAFAFLGLLLNLLNCSQTVISHH69 pKa = 7.09RR70 pKa = 11.84YY71 pKa = 9.48SNDD74 pKa = 2.98NSKK77 pKa = 7.84TQYY80 pKa = 9.05VTISTPSRR88 pKa = 3.37
MM1 pKa = 7.73LSANLNLTVLSGVIGLLLLTRR22 pKa = 11.84STLNLPSIYY31 pKa = 10.52DD32 pKa = 3.82LVPFSLPRR40 pKa = 11.84LVKK43 pKa = 10.13LDD45 pKa = 3.72QIIAFAFLGLLLNLLNCSQTVISHH69 pKa = 7.09RR70 pKa = 11.84YY71 pKa = 9.48SNDD74 pKa = 2.98NSKK77 pKa = 7.84TQYY80 pKa = 9.05VTISTPSRR88 pKa = 3.37
Molecular weight: 9.71 kDa
Isoelectric point according different methods:
Peptides (in silico digests for buttom-up proteomics)
Below you can find in silico digests of the whole proteome with Trypsin, Chymotrypsin, Trypsin+LysC, LysN, ArgC proteases suitable for different mass spec machines.| Try ESI |
 |
|---|
| ChTry ESI |
 |
|---|
| ArgC ESI |
 |
|---|
| LysN ESI |
 |
|---|
| TryLysC ESI |
 |
|---|
| Try MALDI |
 |
|---|
| ChTry MALDI |
 |
|---|
| ArgC MALDI |
 |
|---|
| LysN MALDI |
 |
|---|
| TryLysC MALDI |
 |
|---|
| Try LTQ |
 |
|---|
| ChTry LTQ |
 |
|---|
| ArgC LTQ |
 |
|---|
| LysN LTQ |
 |
|---|
| TryLysC LTQ |
 |
|---|
| Try MSlow |
 |
|---|
| ChTry MSlow |
 |
|---|
| ArgC MSlow |
 |
|---|
| LysN MSlow |
 |
|---|
| TryLysC MSlow |
 |
|---|
| Try MShigh |
 |
|---|
| ChTry MShigh |
 |
|---|
| ArgC MShigh |
 |
|---|
| LysN MShigh |
 |
|---|
| TryLysC MShigh |
 |
|---|
General Statistics
Number of major isoforms |
Number of additional isoforms |
Number of all proteins |
Number of amino acids |
Min. Seq. Length |
Max. Seq. Length |
Avg. Seq. Length |
Avg. Mol. Weight |
|---|---|---|---|---|---|---|---|
0 |
1504 |
61 |
760 |
300.8 |
33.48 |
Amino acid frequency
Ala |
Cys |
Asp |
Glu |
Phe |
Gly |
His |
Ile |
Lys |
Leu |
|---|---|---|---|---|---|---|---|---|---|
8.777 ± 1.381 | 2.261 ± 0.57 |
4.854 ± 0.385 | 4.987 ± 1.075 |
4.721 ± 0.475 | 6.915 ± 0.532 |
1.995 ± 0.531 | 5.585 ± 0.726 |
5.12 ± 0.889 | 8.577 ± 1.55 |
Met |
Asn |
Gln |
Pro |
Arg |
Ser |
Thr |
Val |
Trp |
Tyr |
|---|---|---|---|---|---|---|---|---|---|
2.394 ± 0.355 | 5.319 ± 0.613 |
4.588 ± 0.488 | 2.926 ± 0.304 |
6.516 ± 0.379 | 6.516 ± 1.254 |
6.316 ± 1.122 | 6.981 ± 0.747 |
1.662 ± 0.221 | 2.926 ± 0.498 |
Most of the basic statistics you can see at this page can be downloaded from this CSV file
Proteome-pI is available under Creative Commons Attribution-NoDerivs license, for more details see here
| Reference: Kozlowski LP. Proteome-pI 2.0: Proteome Isoelectric Point Database Update. Nucleic Acids Res. 2021, doi: 10.1093/nar/gkab944 | Contact: Lukasz P. Kozlowski |
