Equine coronavirus
Taxonomy: Viruses; Riboviria; Orthornavirae; Pisuviricota; Pisoniviricetes; Nidovirales; Cornidovirineae; Coronaviridae; Orthocoronavirinae; Betacoronavirus; Embecovirus; Betacoronavirus 1
Average proteome isoelectric point is 6.51
Get precalculated fractions of proteins
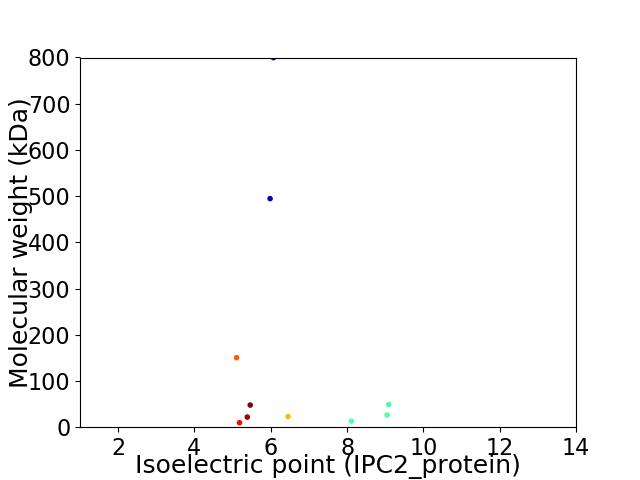
Virtual 2D-PAGE plot for 10 proteins (isoelectric point calculated using IPC2_protein)
Get csv file with sequences according to given criteria:
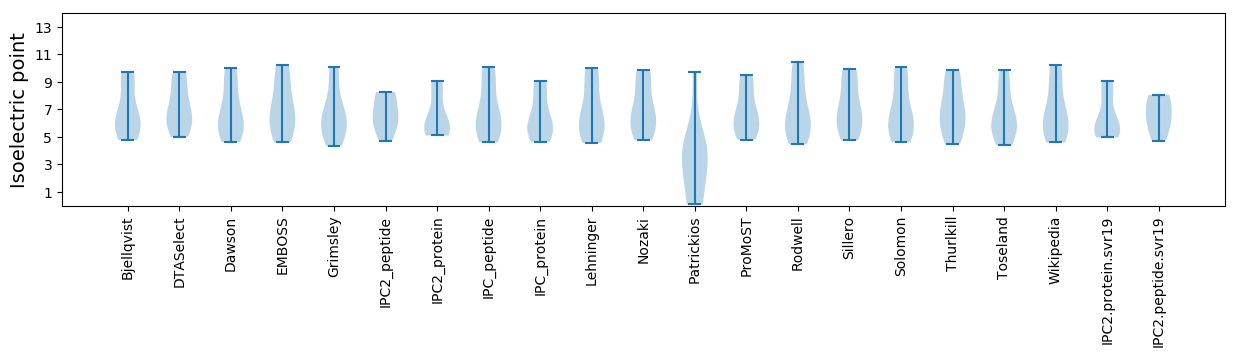
* You can choose from 21 different methods for calculating isoelectric point
Summary statistics related to proteome-wise predictions

Protein with the lowest isoelectric point:
>tr|R4WB36|R4WB36_9BETC 12.7 kDa accessory protein OS=Equine coronavirus OX=136187 GN=p12.7 PE=4 SV=1
MM1 pKa = 7.56LMADD5 pKa = 5.11FYY7 pKa = 11.63LADD10 pKa = 3.89TVWYY14 pKa = 8.76VGQIIFIVAICLLVIIVVVAFLATFKK40 pKa = 11.14LCIQLCGMCNTLVLSPSIYY59 pKa = 9.46VFNRR63 pKa = 11.84GRR65 pKa = 11.84QFYY68 pKa = 10.51EE69 pKa = 4.58LYY71 pKa = 10.42NQVKK75 pKa = 9.8PPVLNVDD82 pKa = 3.98DD83 pKa = 4.16VV84 pKa = 3.67
MM1 pKa = 7.56LMADD5 pKa = 5.11FYY7 pKa = 11.63LADD10 pKa = 3.89TVWYY14 pKa = 8.76VGQIIFIVAICLLVIIVVVAFLATFKK40 pKa = 11.14LCIQLCGMCNTLVLSPSIYY59 pKa = 9.46VFNRR63 pKa = 11.84GRR65 pKa = 11.84QFYY68 pKa = 10.51EE69 pKa = 4.58LYY71 pKa = 10.42NQVKK75 pKa = 9.8PPVLNVDD82 pKa = 3.98DD83 pKa = 4.16VV84 pKa = 3.67
Molecular weight: 9.57 kDa
Isoelectric point according different methods:
Protein with the highest isoelectric point:
>tr|R4WKE3|R4WKE3_9BETC Nucleoprotein OS=Equine coronavirus OX=136187 GN=N PE=3 SV=1
MM1 pKa = 7.55SFTPGKK7 pKa = 9.79QSSSRR12 pKa = 11.84ASSGNRR18 pKa = 11.84SGNGILKK25 pKa = 9.42WADD28 pKa = 3.23QSDD31 pKa = 3.5QSTNFQTRR39 pKa = 11.84GRR41 pKa = 11.84RR42 pKa = 11.84AQPKK46 pKa = 7.97QTATSQPAGGNVVPYY61 pKa = 8.97YY62 pKa = 10.8SWFSGITQFQKK73 pKa = 10.82GKK75 pKa = 9.62EE76 pKa = 3.93FQFAEE81 pKa = 4.59GQGVPIAPGIPSTEE95 pKa = 3.96AKK97 pKa = 10.3GYY99 pKa = 8.63WYY101 pKa = 10.34RR102 pKa = 11.84HH103 pKa = 4.43NRR105 pKa = 11.84RR106 pKa = 11.84SFKK109 pKa = 10.37TADD112 pKa = 3.13GNQRR116 pKa = 11.84QLLPRR121 pKa = 11.84WYY123 pKa = 9.8FYY125 pKa = 11.56YY126 pKa = 10.78LGTGPHH132 pKa = 6.64AKK134 pKa = 9.43VQYY137 pKa = 8.17GTNIDD142 pKa = 3.63GVFWVANKK150 pKa = 9.9QADD153 pKa = 4.06VNTPADD159 pKa = 3.71VVDD162 pKa = 4.88RR163 pKa = 11.84DD164 pKa = 3.84PSSDD168 pKa = 3.16EE169 pKa = 4.8AIPTRR174 pKa = 11.84FPPGTVLPQGYY185 pKa = 9.38YY186 pKa = 9.56IEE188 pKa = 4.79GSGRR192 pKa = 11.84SVSNSRR198 pKa = 11.84STSRR202 pKa = 11.84ASSRR206 pKa = 11.84ASSAGSRR213 pKa = 11.84SRR215 pKa = 11.84ANSGTRR221 pKa = 11.84TSTSGVTPDD230 pKa = 3.74MADD233 pKa = 3.28QIASLVLAKK242 pKa = 10.41LGKK245 pKa = 10.07DD246 pKa = 2.95ATKK249 pKa = 9.49PQQVTKK255 pKa = 9.36QTAKK259 pKa = 10.33EE260 pKa = 4.03VRR262 pKa = 11.84QKK264 pKa = 10.72ILNKK268 pKa = 9.23PRR270 pKa = 11.84QKK272 pKa = 10.46RR273 pKa = 11.84SPNKK277 pKa = 9.02QCTVQQCFGKK287 pKa = 10.48RR288 pKa = 11.84GPNQNFGGAEE298 pKa = 3.96MLKK301 pKa = 10.59LGTSDD306 pKa = 3.38PQFPILAEE314 pKa = 4.05LAPTAGAFFFGSRR327 pKa = 11.84LEE329 pKa = 4.03LAKK332 pKa = 10.64VQNLSGSFDD341 pKa = 3.63EE342 pKa = 4.67PQKK345 pKa = 11.02DD346 pKa = 4.14VYY348 pKa = 9.8EE349 pKa = 3.97LRR351 pKa = 11.84YY352 pKa = 10.38NGAIRR357 pKa = 11.84FDD359 pKa = 3.51STLPGFEE366 pKa = 4.83TIMKK370 pKa = 9.51VLNEE374 pKa = 4.23NLNAYY379 pKa = 7.25QQQDD383 pKa = 3.77DD384 pKa = 4.49GTNMSPKK391 pKa = 9.33PQRR394 pKa = 11.84QRR396 pKa = 11.84GQKK399 pKa = 10.01KK400 pKa = 9.24GGEE403 pKa = 4.15NEE405 pKa = 4.34DD406 pKa = 3.5VSVAAPKK413 pKa = 10.72SRR415 pKa = 11.84VQQNKK420 pKa = 9.07SRR422 pKa = 11.84EE423 pKa = 4.15LTAEE427 pKa = 4.82DD428 pKa = 3.74ISLLKK433 pKa = 11.01QMDD436 pKa = 4.01DD437 pKa = 4.38PLTEE441 pKa = 5.41DD442 pKa = 3.29NSEE445 pKa = 3.98MM446 pKa = 4.58
MM1 pKa = 7.55SFTPGKK7 pKa = 9.79QSSSRR12 pKa = 11.84ASSGNRR18 pKa = 11.84SGNGILKK25 pKa = 9.42WADD28 pKa = 3.23QSDD31 pKa = 3.5QSTNFQTRR39 pKa = 11.84GRR41 pKa = 11.84RR42 pKa = 11.84AQPKK46 pKa = 7.97QTATSQPAGGNVVPYY61 pKa = 8.97YY62 pKa = 10.8SWFSGITQFQKK73 pKa = 10.82GKK75 pKa = 9.62EE76 pKa = 3.93FQFAEE81 pKa = 4.59GQGVPIAPGIPSTEE95 pKa = 3.96AKK97 pKa = 10.3GYY99 pKa = 8.63WYY101 pKa = 10.34RR102 pKa = 11.84HH103 pKa = 4.43NRR105 pKa = 11.84RR106 pKa = 11.84SFKK109 pKa = 10.37TADD112 pKa = 3.13GNQRR116 pKa = 11.84QLLPRR121 pKa = 11.84WYY123 pKa = 9.8FYY125 pKa = 11.56YY126 pKa = 10.78LGTGPHH132 pKa = 6.64AKK134 pKa = 9.43VQYY137 pKa = 8.17GTNIDD142 pKa = 3.63GVFWVANKK150 pKa = 9.9QADD153 pKa = 4.06VNTPADD159 pKa = 3.71VVDD162 pKa = 4.88RR163 pKa = 11.84DD164 pKa = 3.84PSSDD168 pKa = 3.16EE169 pKa = 4.8AIPTRR174 pKa = 11.84FPPGTVLPQGYY185 pKa = 9.38YY186 pKa = 9.56IEE188 pKa = 4.79GSGRR192 pKa = 11.84SVSNSRR198 pKa = 11.84STSRR202 pKa = 11.84ASSRR206 pKa = 11.84ASSAGSRR213 pKa = 11.84SRR215 pKa = 11.84ANSGTRR221 pKa = 11.84TSTSGVTPDD230 pKa = 3.74MADD233 pKa = 3.28QIASLVLAKK242 pKa = 10.41LGKK245 pKa = 10.07DD246 pKa = 2.95ATKK249 pKa = 9.49PQQVTKK255 pKa = 9.36QTAKK259 pKa = 10.33EE260 pKa = 4.03VRR262 pKa = 11.84QKK264 pKa = 10.72ILNKK268 pKa = 9.23PRR270 pKa = 11.84QKK272 pKa = 10.46RR273 pKa = 11.84SPNKK277 pKa = 9.02QCTVQQCFGKK287 pKa = 10.48RR288 pKa = 11.84GPNQNFGGAEE298 pKa = 3.96MLKK301 pKa = 10.59LGTSDD306 pKa = 3.38PQFPILAEE314 pKa = 4.05LAPTAGAFFFGSRR327 pKa = 11.84LEE329 pKa = 4.03LAKK332 pKa = 10.64VQNLSGSFDD341 pKa = 3.63EE342 pKa = 4.67PQKK345 pKa = 11.02DD346 pKa = 4.14VYY348 pKa = 9.8EE349 pKa = 3.97LRR351 pKa = 11.84YY352 pKa = 10.38NGAIRR357 pKa = 11.84FDD359 pKa = 3.51STLPGFEE366 pKa = 4.83TIMKK370 pKa = 9.51VLNEE374 pKa = 4.23NLNAYY379 pKa = 7.25QQQDD383 pKa = 3.77DD384 pKa = 4.49GTNMSPKK391 pKa = 9.33PQRR394 pKa = 11.84QRR396 pKa = 11.84GQKK399 pKa = 10.01KK400 pKa = 9.24GGEE403 pKa = 4.15NEE405 pKa = 4.34DD406 pKa = 3.5VSVAAPKK413 pKa = 10.72SRR415 pKa = 11.84VQQNKK420 pKa = 9.07SRR422 pKa = 11.84EE423 pKa = 4.15LTAEE427 pKa = 4.82DD428 pKa = 3.74ISLLKK433 pKa = 11.01QMDD436 pKa = 4.01DD437 pKa = 4.38PLTEE441 pKa = 5.41DD442 pKa = 3.29NSEE445 pKa = 3.98MM446 pKa = 4.58
Molecular weight: 49.02 kDa
Isoelectric point according different methods:
Peptides (in silico digests for buttom-up proteomics)
Below you can find in silico digests of the whole proteome with Trypsin, Chymotrypsin, Trypsin+LysC, LysN, ArgC proteases suitable for different mass spec machines.| Try ESI |
 |
|---|
| ChTry ESI |
|
|---|
| ArgC ESI |
|
|---|
| LysN ESI |
|
|---|
| TryLysC ESI |
|
|---|
| Try MALDI |
|
|---|
| ChTry MALDI |
|
|---|
| ArgC MALDI |
|
|---|
| LysN MALDI |
|
|---|
| TryLysC MALDI |
|
|---|
| Try LTQ |
|
|---|
| ChTry LTQ |
|
|---|
| ArgC LTQ |
|
|---|
| LysN LTQ |
|
|---|
| TryLysC LTQ |
|
|---|
| Try MSlow |
|
|---|
| ChTry MSlow |
|
|---|
| ArgC MSlow |
|
|---|
| LysN MSlow |
|
|---|
| TryLysC MSlow |
|
|---|
| Try MShigh |
|
|---|
| ChTry MShigh |
|
|---|
| ArgC MShigh |
|
|---|
| LysN MShigh |
|
|---|
| TryLysC MShigh |
|
|---|
General Statistics
Number of major isoforms |
Number of additional isoforms |
Number of all proteins |
Number of amino acids |
Min. Seq. Length |
Max. Seq. Length |
Avg. Seq. Length |
Avg. Mol. Weight |
|---|---|---|---|---|---|---|---|
0 |
14590 |
84 |
7117 |
1459.0 |
163.53 |
Amino acid frequency
Ala |
Cys |
Asp |
Glu |
Phe |
Gly |
His |
Ile |
Lys |
Leu |
|---|---|---|---|---|---|---|---|---|---|
6.552 ± 0.315 | 3.53 ± 0.295 |
5.97 ± 0.448 | 3.619 ± 0.157 |
5.517 ± 0.163 | 5.86 ± 0.344 |
1.549 ± 0.151 | 5.422 ± 0.354 |
5.798 ± 0.587 | 9.191 ± 0.647 |
Met |
Asn |
Gln |
Pro |
Arg |
Ser |
Thr |
Val |
Trp |
Tyr |
|---|---|---|---|---|---|---|---|---|---|
2.207 ± 0.168 | 5.469 ± 0.581 |
3.276 ± 0.474 | 3.626 ± 0.29 |
3.427 ± 0.284 | 7.361 ± 0.22 |
5.696 ± 0.296 | 9.527 ± 0.753 |
1.295 ± 0.071 | 5.106 ± 0.303 |
Most of the basic statistics you can see at this page can be downloaded from this CSV file
See this proteome in:

Proteome-pI is available under Creative Commons Attribution-NoDerivs license, for more details see here
| Reference: Kozlowski LP. Proteome-pI 2.0: Proteome Isoelectric Point Database Update. Nucleic Acids Res. 2021, doi: 10.1093/nar/gkab944 | Contact: Lukasz P. Kozlowski |