Pea streak virus
Taxonomy: Viruses; Riboviria; Orthornavirae; Kitrinoviricota; Alsuviricetes; Tymovirales; Betaflexiviridae; Quinvirinae; Carlavirus
Average proteome isoelectric point is 6.94
Get precalculated fractions of proteins

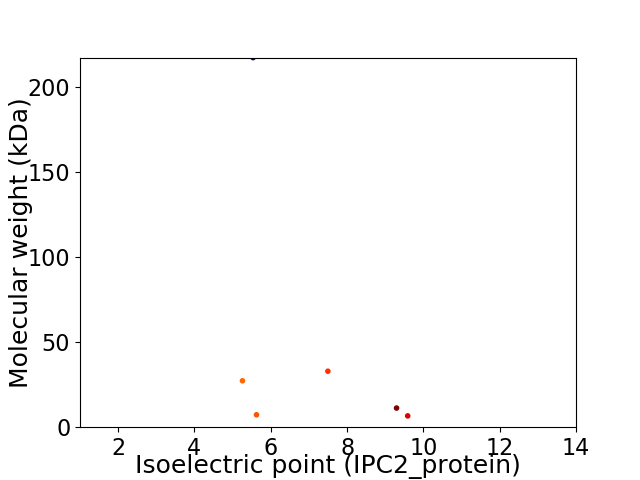
Virtual 2D-PAGE plot for 6 proteins (isoelectric point calculated using IPC2_protein)
Get csv file with sequences according to given criteria:
* You can choose from 21 different methods for calculating isoelectric point
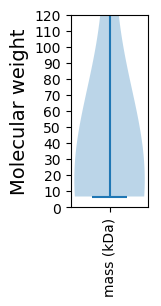
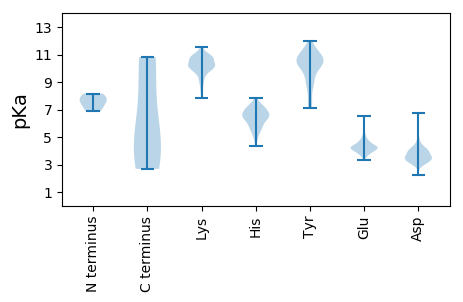
Summary statistics related to proteome-wise predictions


Protein with the lowest isoelectric point:
>tr|A0A0H3YGY3|A0A0H3YGY3_9VIRU Helicase OS=Pea streak virus OX=157777 PE=3 SV=1
MM1 pKa = 7.97DD2 pKa = 4.01VFINNLLEE10 pKa = 4.3CGFRR14 pKa = 11.84RR15 pKa = 11.84NKK17 pKa = 10.03IVFDD21 pKa = 3.98LPIVVLAVPGAGKK34 pKa = 8.68TSSIRR39 pKa = 11.84RR40 pKa = 11.84LLRR43 pKa = 11.84QDD45 pKa = 3.17SRR47 pKa = 11.84FEE49 pKa = 3.58AWTFGVADD57 pKa = 3.63HH58 pKa = 6.95HH59 pKa = 6.31NCSGRR64 pKa = 11.84FIKK67 pKa = 10.64GISEE71 pKa = 4.04EE72 pKa = 4.37SKK74 pKa = 10.12PDD76 pKa = 3.47PSKK79 pKa = 10.97FILIDD84 pKa = 3.22EE85 pKa = 4.76FQRR88 pKa = 11.84GDD90 pKa = 3.34WEE92 pKa = 4.14KK93 pKa = 10.89LKK95 pKa = 10.77PFAIFGDD102 pKa = 3.93IAQLMLKK109 pKa = 10.2SSAAFEE115 pKa = 4.84SVFSKK120 pKa = 10.64CSSHH124 pKa = 6.81RR125 pKa = 11.84VPLPIVKK132 pKa = 10.13LLQEE136 pKa = 4.68LDD138 pKa = 3.88FEE140 pKa = 4.57ITSEE144 pKa = 4.27RR145 pKa = 11.84EE146 pKa = 3.62GVLEE150 pKa = 3.88VRR152 pKa = 11.84TLLGSEE158 pKa = 4.17PEE160 pKa = 4.28GVVTCFEE167 pKa = 4.49SEE169 pKa = 4.04VCEE172 pKa = 3.94FLDD175 pKa = 4.34YY176 pKa = 11.39NQINHH181 pKa = 7.2KK182 pKa = 10.38SPADD186 pKa = 3.54IIGLEE191 pKa = 4.26FPTVSLVISGKK202 pKa = 9.0SAIGVHH208 pKa = 5.57RR209 pKa = 11.84AEE211 pKa = 5.86FYY213 pKa = 10.4ICCTRR218 pKa = 11.84ATEE221 pKa = 4.07KK222 pKa = 11.07LLIITPEE229 pKa = 3.72PEE231 pKa = 4.17GFHH234 pKa = 6.16NCSNAIDD241 pKa = 3.94STSS244 pKa = 2.68
MM1 pKa = 7.97DD2 pKa = 4.01VFINNLLEE10 pKa = 4.3CGFRR14 pKa = 11.84RR15 pKa = 11.84NKK17 pKa = 10.03IVFDD21 pKa = 3.98LPIVVLAVPGAGKK34 pKa = 8.68TSSIRR39 pKa = 11.84RR40 pKa = 11.84LLRR43 pKa = 11.84QDD45 pKa = 3.17SRR47 pKa = 11.84FEE49 pKa = 3.58AWTFGVADD57 pKa = 3.63HH58 pKa = 6.95HH59 pKa = 6.31NCSGRR64 pKa = 11.84FIKK67 pKa = 10.64GISEE71 pKa = 4.04EE72 pKa = 4.37SKK74 pKa = 10.12PDD76 pKa = 3.47PSKK79 pKa = 10.97FILIDD84 pKa = 3.22EE85 pKa = 4.76FQRR88 pKa = 11.84GDD90 pKa = 3.34WEE92 pKa = 4.14KK93 pKa = 10.89LKK95 pKa = 10.77PFAIFGDD102 pKa = 3.93IAQLMLKK109 pKa = 10.2SSAAFEE115 pKa = 4.84SVFSKK120 pKa = 10.64CSSHH124 pKa = 6.81RR125 pKa = 11.84VPLPIVKK132 pKa = 10.13LLQEE136 pKa = 4.68LDD138 pKa = 3.88FEE140 pKa = 4.57ITSEE144 pKa = 4.27RR145 pKa = 11.84EE146 pKa = 3.62GVLEE150 pKa = 3.88VRR152 pKa = 11.84TLLGSEE158 pKa = 4.17PEE160 pKa = 4.28GVVTCFEE167 pKa = 4.49SEE169 pKa = 4.04VCEE172 pKa = 3.94FLDD175 pKa = 4.34YY176 pKa = 11.39NQINHH181 pKa = 7.2KK182 pKa = 10.38SPADD186 pKa = 3.54IIGLEE191 pKa = 4.26FPTVSLVISGKK202 pKa = 9.0SAIGVHH208 pKa = 5.57RR209 pKa = 11.84AEE211 pKa = 5.86FYY213 pKa = 10.4ICCTRR218 pKa = 11.84ATEE221 pKa = 4.07KK222 pKa = 11.07LLIITPEE229 pKa = 3.72PEE231 pKa = 4.17GFHH234 pKa = 6.16NCSNAIDD241 pKa = 3.94STSS244 pKa = 2.68
Molecular weight: 27.26 kDa
Isoelectric point according different methods:
Protein with the highest isoelectric point:
>tr|A0A0H3YH99|A0A0H3YH99_9VIRU 7 kDa protein OS=Pea streak virus OX=157777 PE=3 SV=1
MM1 pKa = 6.88STSPSTLIRR10 pKa = 11.84RR11 pKa = 11.84TLWLEE16 pKa = 3.64LTEE19 pKa = 4.38IADD22 pKa = 3.81TRR24 pKa = 11.84VMMRR28 pKa = 11.84LLPVVCSVVEE38 pKa = 3.79PRR40 pKa = 11.84KK41 pKa = 9.93IGVIMRR47 pKa = 11.84AKK49 pKa = 10.1CVRR52 pKa = 11.84LLVKK56 pKa = 10.42PKK58 pKa = 10.66
MM1 pKa = 6.88STSPSTLIRR10 pKa = 11.84RR11 pKa = 11.84TLWLEE16 pKa = 3.64LTEE19 pKa = 4.38IADD22 pKa = 3.81TRR24 pKa = 11.84VMMRR28 pKa = 11.84LLPVVCSVVEE38 pKa = 3.79PRR40 pKa = 11.84KK41 pKa = 9.93IGVIMRR47 pKa = 11.84AKK49 pKa = 10.1CVRR52 pKa = 11.84LLVKK56 pKa = 10.42PKK58 pKa = 10.66
Molecular weight: 6.64 kDa
Isoelectric point according different methods:
Peptides (in silico digests for buttom-up proteomics)
Below you can find in silico digests of the whole proteome with Trypsin, Chymotrypsin, Trypsin+LysC, LysN, ArgC proteases suitable for different mass spec machines.| Try ESI |
 |
|---|
| ChTry ESI |
 |
|---|
| ArgC ESI |
 |
|---|
| LysN ESI |
 |
|---|
| TryLysC ESI |
 |
|---|
| Try MALDI |
 |
|---|
| ChTry MALDI |
 |
|---|
| ArgC MALDI |
 |
|---|
| LysN MALDI |
 |
|---|
| TryLysC MALDI |
 |
|---|
| Try LTQ |
 |
|---|
| ChTry LTQ |
 |
|---|
| ArgC LTQ |
 |
|---|
| LysN LTQ |
 |
|---|
| TryLysC LTQ |
 |
|---|
| Try MSlow |
 |
|---|
| ChTry MSlow |
 |
|---|
| ArgC MSlow |
 |
|---|
| LysN MSlow |
 |
|---|
| TryLysC MSlow |
 |
|---|
| Try MShigh |
 |
|---|
| ChTry MShigh |
 |
|---|
| ArgC MShigh |
 |
|---|
| LysN MShigh |
 |
|---|
| TryLysC MShigh |
 |
|---|
General Statistics
Number of major isoforms |
Number of additional isoforms |
Number of all proteins |
Number of amino acids |
Min. Seq. Length |
Max. Seq. Length |
Avg. Seq. Length |
Avg. Mol. Weight |
|---|---|---|---|---|---|---|---|
0 |
2674 |
58 |
1908 |
445.7 |
50.4 |
Amino acid frequency
Ala |
Cys |
Asp |
Glu |
Phe |
Gly |
His |
Ile |
Lys |
Leu |
|---|---|---|---|---|---|---|---|---|---|
6.956 ± 1.086 | 2.58 ± 0.351 |
5.273 ± 0.723 | 7.741 ± 1.142 |
5.497 ± 0.654 | 6.133 ± 0.366 |
2.169 ± 0.34 | 6.47 ± 1.147 |
6.395 ± 0.285 | 10.845 ± 1.111 |
Met |
Asn |
Gln |
Pro |
Arg |
Ser |
Thr |
Val |
Trp |
Tyr |
|---|---|---|---|---|---|---|---|---|---|
1.982 ± 0.401 | 4.525 ± 0.767 |
3.441 ± 0.666 | 3.067 ± 0.585 |
5.572 ± 0.607 | 7.031 ± 0.666 |
4.525 ± 0.35 | 5.684 ± 0.76 |
1.01 ± 0.228 | 3.104 ± 0.803 |
Most of the basic statistics you can see at this page can be downloaded from this CSV file
Proteome-pI is available under Creative Commons Attribution-NoDerivs license, for more details see here
| Reference: Kozlowski LP. Proteome-pI 2.0: Proteome Isoelectric Point Database Update. Nucleic Acids Res. 2021, doi: 10.1093/nar/gkab944 | Contact: Lukasz P. Kozlowski |
