Haloechinothrix halophila YIM 93223
Taxonomy: cellular organisms; Bacteria; Terrabacteria group; Actinobacteria; Actinomycetia; Pseudonocardiales; Pseudonocardiaceae; Haloechinothrix; Haloechinothrix halophila
Average proteome isoelectric point is 6.19
Get precalculated fractions of proteins

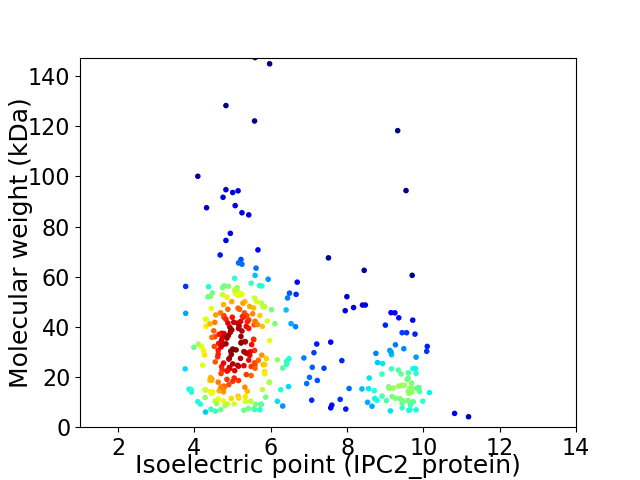
Virtual 2D-PAGE plot for 356 proteins (isoelectric point calculated using IPC2_protein)
Get csv file with sequences according to given criteria:
* You can choose from 21 different methods for calculating isoelectric point
Summary statistics related to proteome-wise predictions


Protein with the lowest isoelectric point:
>tr|W9DRV0|W9DRV0_9PSEU Protein translocase subunit SecY OS=Haloechinothrix halophila YIM 93223 OX=592678 GN=secY PE=3 SV=1
MM1 pKa = 7.44KK2 pKa = 10.29RR3 pKa = 11.84PLVRR7 pKa = 11.84SLLVGAAMLGGSVVVSMAPAAADD30 pKa = 3.44TAQAEE35 pKa = 4.2QSDD38 pKa = 4.25AVVSQSAATTKK49 pKa = 10.77GEE51 pKa = 3.78QSRR54 pKa = 11.84IDD56 pKa = 4.0SYY58 pKa = 9.51WTDD61 pKa = 3.49DD62 pKa = 3.45RR63 pKa = 11.84MEE65 pKa = 4.56DD66 pKa = 3.43AVPAEE71 pKa = 4.18TRR73 pKa = 11.84FGNRR77 pKa = 11.84PKK79 pKa = 10.25KK80 pKa = 10.2DD81 pKa = 3.22HH82 pKa = 6.57QGPDD86 pKa = 3.37DD87 pKa = 3.59CRR89 pKa = 11.84GNGRR93 pKa = 11.84WACPDD98 pKa = 3.5EE99 pKa = 6.01DD100 pKa = 3.78STATQEE106 pKa = 4.23EE107 pKa = 4.58PQPEE111 pKa = 4.19LGKK114 pKa = 10.84VFFTLSGTDD123 pKa = 3.79YY124 pKa = 10.53VCSGTATSSSNGDD137 pKa = 3.46VVTTAGHH144 pKa = 6.64CLNEE148 pKa = 4.5GPGDD152 pKa = 3.64FATNFAFVPAYY163 pKa = 10.12EE164 pKa = 4.74NGAEE168 pKa = 4.57PYY170 pKa = 10.37GKK172 pKa = 7.73WTAAEE177 pKa = 4.37LFTTEE182 pKa = 3.55QWATAGDD189 pKa = 3.91FEE191 pKa = 5.06YY192 pKa = 11.05DD193 pKa = 2.84AGFAVMNEE201 pKa = 4.06NASGQSLTDD210 pKa = 3.29VVGSYY215 pKa = 10.47PIAFNLSRR223 pKa = 11.84GLDD226 pKa = 3.61YY227 pKa = 11.03KK228 pKa = 11.24SYY230 pKa = 10.0GYY232 pKa = 9.31PAASPFDD239 pKa = 4.93GEE241 pKa = 4.76TLWSCTGTATDD252 pKa = 4.87DD253 pKa = 4.14PNGSSTQGIPCEE265 pKa = 4.12MTGGSSGGGWITGGQLNSVNSYY287 pKa = 10.3KK288 pKa = 10.6YY289 pKa = 10.35RR290 pKa = 11.84GDD292 pKa = 3.63DD293 pKa = 3.16STMYY297 pKa = 10.56GPYY300 pKa = 9.12FGSVIEE306 pKa = 4.62SVYY309 pKa = 9.3QTASAAA315 pKa = 3.53
MM1 pKa = 7.44KK2 pKa = 10.29RR3 pKa = 11.84PLVRR7 pKa = 11.84SLLVGAAMLGGSVVVSMAPAAADD30 pKa = 3.44TAQAEE35 pKa = 4.2QSDD38 pKa = 4.25AVVSQSAATTKK49 pKa = 10.77GEE51 pKa = 3.78QSRR54 pKa = 11.84IDD56 pKa = 4.0SYY58 pKa = 9.51WTDD61 pKa = 3.49DD62 pKa = 3.45RR63 pKa = 11.84MEE65 pKa = 4.56DD66 pKa = 3.43AVPAEE71 pKa = 4.18TRR73 pKa = 11.84FGNRR77 pKa = 11.84PKK79 pKa = 10.25KK80 pKa = 10.2DD81 pKa = 3.22HH82 pKa = 6.57QGPDD86 pKa = 3.37DD87 pKa = 3.59CRR89 pKa = 11.84GNGRR93 pKa = 11.84WACPDD98 pKa = 3.5EE99 pKa = 6.01DD100 pKa = 3.78STATQEE106 pKa = 4.23EE107 pKa = 4.58PQPEE111 pKa = 4.19LGKK114 pKa = 10.84VFFTLSGTDD123 pKa = 3.79YY124 pKa = 10.53VCSGTATSSSNGDD137 pKa = 3.46VVTTAGHH144 pKa = 6.64CLNEE148 pKa = 4.5GPGDD152 pKa = 3.64FATNFAFVPAYY163 pKa = 10.12EE164 pKa = 4.74NGAEE168 pKa = 4.57PYY170 pKa = 10.37GKK172 pKa = 7.73WTAAEE177 pKa = 4.37LFTTEE182 pKa = 3.55QWATAGDD189 pKa = 3.91FEE191 pKa = 5.06YY192 pKa = 11.05DD193 pKa = 2.84AGFAVMNEE201 pKa = 4.06NASGQSLTDD210 pKa = 3.29VVGSYY215 pKa = 10.47PIAFNLSRR223 pKa = 11.84GLDD226 pKa = 3.61YY227 pKa = 11.03KK228 pKa = 11.24SYY230 pKa = 10.0GYY232 pKa = 9.31PAASPFDD239 pKa = 4.93GEE241 pKa = 4.76TLWSCTGTATDD252 pKa = 4.87DD253 pKa = 4.14PNGSSTQGIPCEE265 pKa = 4.12MTGGSSGGGWITGGQLNSVNSYY287 pKa = 10.3KK288 pKa = 10.6YY289 pKa = 10.35RR290 pKa = 11.84GDD292 pKa = 3.63DD293 pKa = 3.16STMYY297 pKa = 10.56GPYY300 pKa = 9.12FGSVIEE306 pKa = 4.62SVYY309 pKa = 9.3QTASAAA315 pKa = 3.53
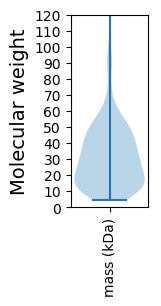
Molecular weight: 33.16 kDa
Isoelectric point according different methods:
Protein with the highest isoelectric point:
>tr|W9DNK6|W9DNK6_9PSEU Uncharacterized protein OS=Haloechinothrix halophila YIM 93223 OX=592678 GN=AmyhaDRAFT_0293 PE=4 SV=1
MM1 pKa = 7.4GSVIKK6 pKa = 10.38KK7 pKa = 8.42RR8 pKa = 11.84RR9 pKa = 11.84KK10 pKa = 9.06RR11 pKa = 11.84MSKK14 pKa = 9.76KK15 pKa = 9.54KK16 pKa = 9.72HH17 pKa = 5.63RR18 pKa = 11.84KK19 pKa = 7.56LLRR22 pKa = 11.84RR23 pKa = 11.84TRR25 pKa = 11.84VQRR28 pKa = 11.84RR29 pKa = 11.84KK30 pKa = 9.71QGKK33 pKa = 8.65
MM1 pKa = 7.4GSVIKK6 pKa = 10.38KK7 pKa = 8.42RR8 pKa = 11.84RR9 pKa = 11.84KK10 pKa = 9.06RR11 pKa = 11.84MSKK14 pKa = 9.76KK15 pKa = 9.54KK16 pKa = 9.72HH17 pKa = 5.63RR18 pKa = 11.84KK19 pKa = 7.56LLRR22 pKa = 11.84RR23 pKa = 11.84TRR25 pKa = 11.84VQRR28 pKa = 11.84RR29 pKa = 11.84KK30 pKa = 9.71QGKK33 pKa = 8.65
Molecular weight: 4.16 kDa
Isoelectric point according different methods:
Peptides (in silico digests for buttom-up proteomics)
Below you can find in silico digests of the whole proteome with Trypsin, Chymotrypsin, Trypsin+LysC, LysN, ArgC proteases suitable for different mass spec machines.| Try ESI |
 |
|---|
| ChTry ESI |
 |
|---|
| ArgC ESI |
 |
|---|
| LysN ESI |
 |
|---|
| TryLysC ESI |
 |
|---|
| Try MALDI |
 |
|---|
| ChTry MALDI |
 |
|---|
| ArgC MALDI |
 |
|---|
| LysN MALDI |
 |
|---|
| TryLysC MALDI |
 |
|---|
| Try LTQ |
 |
|---|
| ChTry LTQ |
 |
|---|
| ArgC LTQ |
 |
|---|
| LysN LTQ |
 |
|---|
| TryLysC LTQ |
 |
|---|
| Try MSlow |
 |
|---|
| ChTry MSlow |
 |
|---|
| ArgC MSlow |
 |
|---|
| LysN MSlow |
 |
|---|
| TryLysC MSlow |
 |
|---|
| Try MShigh |
 |
|---|
| ChTry MShigh |
 |
|---|
| ArgC MShigh |
 |
|---|
| LysN MShigh |
 |
|---|
| TryLysC MShigh |
 |
|---|
General Statistics
Number of major isoforms |
Number of additional isoforms |
Number of all proteins |
Number of amino acids |
Min. Seq. Length |
Max. Seq. Length |
Avg. Seq. Length |
Avg. Mol. Weight |
|---|---|---|---|---|---|---|---|
0 |
109024 |
33 |
1341 |
306.2 |
32.87 |
Amino acid frequency
Ala |
Cys |
Asp |
Glu |
Phe |
Gly |
His |
Ile |
Lys |
Leu |
|---|---|---|---|---|---|---|---|---|---|
12.445 ± 0.21 | 0.733 ± 0.035 |
6.378 ± 0.103 | 6.007 ± 0.135 |
2.894 ± 0.077 | 9.178 ± 0.142 |
2.019 ± 0.06 | 4.104 ± 0.102 |
2.93 ± 0.123 | 9.506 ± 0.174 |
Met |
Asn |
Gln |
Pro |
Arg |
Ser |
Thr |
Val |
Trp |
Tyr |
|---|---|---|---|---|---|---|---|---|---|
1.978 ± 0.058 | 2.168 ± 0.065 |
5.69 ± 0.147 | 3.042 ± 0.097 |
7.277 ± 0.151 | 5.527 ± 0.095 |
6.121 ± 0.118 | 8.691 ± 0.122 |
1.259 ± 0.051 | 2.053 ± 0.066 |
Most of the basic statistics you can see at this page can be downloaded from this CSV file
Proteome-pI is available under Creative Commons Attribution-NoDerivs license, for more details see here
| Reference: Kozlowski LP. Proteome-pI 2.0: Proteome Isoelectric Point Database Update. Nucleic Acids Res. 2021, doi: 10.1093/nar/gkab944 | Contact: Lukasz P. Kozlowski |
