Vibrio phage martha 12B12
Taxonomy: Viruses; Duplodnaviria; Heunggongvirae; Uroviricota; Caudoviricetes; Caudovirales; Myoviridae; unclassified Myoviridae
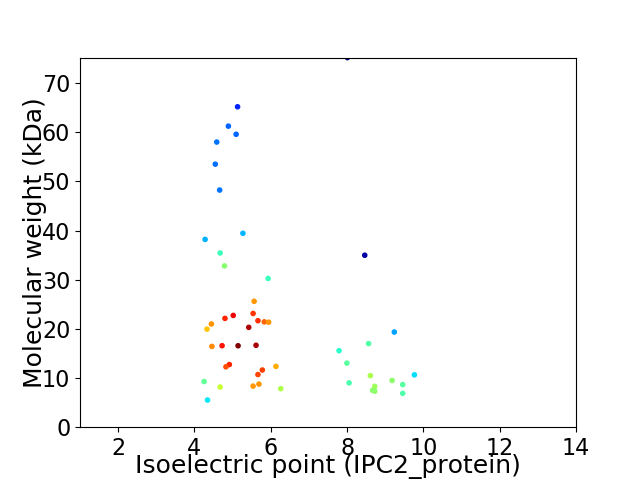
Average proteome isoelectric point is 6.16
Get precalculated fractions of proteins

Virtual 2D-PAGE plot for 51 proteins (isoelectric point calculated using IPC2_protein)
Get csv file with sequences according to given criteria:
* You can choose from 21 different methods for calculating isoelectric point
Summary statistics related to proteome-wise predictions


Protein with the lowest isoelectric point:
>tr|M4MHE6|M4MHE6_9CAUD Phage tail tape measure protein OS=Vibrio phage martha 12B12 OX=573175 GN=VPCG_00008 PE=4 SV=1
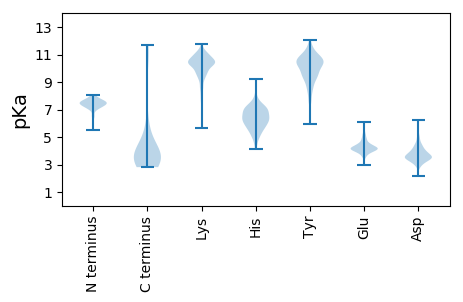
MM1 pKa = 7.7PFNVPTLRR9 pKa = 11.84QLIEE13 pKa = 4.24SGLIDD18 pKa = 4.3IEE20 pKa = 4.62ASLDD24 pKa = 3.4TLLPKK29 pKa = 10.71FGIEE33 pKa = 3.78QALNASVSGSIRR45 pKa = 11.84DD46 pKa = 3.63LYY48 pKa = 10.99DD49 pKa = 3.13YY50 pKa = 7.57QTWIVRR56 pKa = 11.84QIIPSSEE63 pKa = 4.4SEE65 pKa = 4.21DD66 pKa = 3.29QTIIDD71 pKa = 3.64TARR74 pKa = 11.84YY75 pKa = 9.22EE76 pKa = 4.43GVLQKK81 pKa = 10.73LASNAFGPVTFTGDD95 pKa = 3.07VPIPVDD101 pKa = 3.41TVMTHH106 pKa = 5.67SDD108 pKa = 2.76GRR110 pKa = 11.84LYY112 pKa = 10.71RR113 pKa = 11.84VTLSNAPSGGTVVVQVEE130 pKa = 4.11AEE132 pKa = 4.1EE133 pKa = 4.58AGVAGNLDD141 pKa = 3.46SDD143 pKa = 3.82QTLTLVSTVPCIQPNGITGEE163 pKa = 3.96ISGGADD169 pKa = 3.26IEE171 pKa = 4.5PVAQVLEE178 pKa = 3.95RR179 pKa = 11.84LLFRR183 pKa = 11.84KK184 pKa = 9.86RR185 pKa = 11.84NPPMGGALHH194 pKa = 7.57DD195 pKa = 3.91YY196 pKa = 9.56VAWCRR201 pKa = 11.84EE202 pKa = 3.84VSGVTRR208 pKa = 11.84AWCIDD213 pKa = 4.44LYY215 pKa = 10.94QGPATVGYY223 pKa = 10.59AFVYY227 pKa = 10.06DD228 pKa = 4.15EE229 pKa = 4.92RR230 pKa = 11.84ADD232 pKa = 3.98IIPTYY237 pKa = 9.12TDD239 pKa = 3.05QVAMTDD245 pKa = 3.4YY246 pKa = 10.55IYY248 pKa = 10.64RR249 pKa = 11.84HH250 pKa = 6.94PDD252 pKa = 3.09PATGTDD258 pKa = 2.9VGRR261 pKa = 11.84PGGIEE266 pKa = 3.67AVYY269 pKa = 10.39IPLQLKK275 pKa = 8.03EE276 pKa = 4.21TDD278 pKa = 3.33LGITISPDD286 pKa = 3.14NTDD289 pKa = 3.05LRR291 pKa = 11.84QSVKK295 pKa = 10.12TSIEE299 pKa = 4.25GYY301 pKa = 10.12IKK303 pKa = 9.75TLSPGSTLQLSSVRR317 pKa = 11.84TAIGSTPGVSDD328 pKa = 3.88YY329 pKa = 11.76VLDD332 pKa = 4.46LNADD336 pKa = 3.67VPALSSEE343 pKa = 3.96LHH345 pKa = 5.89ALGVITWGTMM355 pKa = 2.9
MM1 pKa = 7.7PFNVPTLRR9 pKa = 11.84QLIEE13 pKa = 4.24SGLIDD18 pKa = 4.3IEE20 pKa = 4.62ASLDD24 pKa = 3.4TLLPKK29 pKa = 10.71FGIEE33 pKa = 3.78QALNASVSGSIRR45 pKa = 11.84DD46 pKa = 3.63LYY48 pKa = 10.99DD49 pKa = 3.13YY50 pKa = 7.57QTWIVRR56 pKa = 11.84QIIPSSEE63 pKa = 4.4SEE65 pKa = 4.21DD66 pKa = 3.29QTIIDD71 pKa = 3.64TARR74 pKa = 11.84YY75 pKa = 9.22EE76 pKa = 4.43GVLQKK81 pKa = 10.73LASNAFGPVTFTGDD95 pKa = 3.07VPIPVDD101 pKa = 3.41TVMTHH106 pKa = 5.67SDD108 pKa = 2.76GRR110 pKa = 11.84LYY112 pKa = 10.71RR113 pKa = 11.84VTLSNAPSGGTVVVQVEE130 pKa = 4.11AEE132 pKa = 4.1EE133 pKa = 4.58AGVAGNLDD141 pKa = 3.46SDD143 pKa = 3.82QTLTLVSTVPCIQPNGITGEE163 pKa = 3.96ISGGADD169 pKa = 3.26IEE171 pKa = 4.5PVAQVLEE178 pKa = 3.95RR179 pKa = 11.84LLFRR183 pKa = 11.84KK184 pKa = 9.86RR185 pKa = 11.84NPPMGGALHH194 pKa = 7.57DD195 pKa = 3.91YY196 pKa = 9.56VAWCRR201 pKa = 11.84EE202 pKa = 3.84VSGVTRR208 pKa = 11.84AWCIDD213 pKa = 4.44LYY215 pKa = 10.94QGPATVGYY223 pKa = 10.59AFVYY227 pKa = 10.06DD228 pKa = 4.15EE229 pKa = 4.92RR230 pKa = 11.84ADD232 pKa = 3.98IIPTYY237 pKa = 9.12TDD239 pKa = 3.05QVAMTDD245 pKa = 3.4YY246 pKa = 10.55IYY248 pKa = 10.64RR249 pKa = 11.84HH250 pKa = 6.94PDD252 pKa = 3.09PATGTDD258 pKa = 2.9VGRR261 pKa = 11.84PGGIEE266 pKa = 3.67AVYY269 pKa = 10.39IPLQLKK275 pKa = 8.03EE276 pKa = 4.21TDD278 pKa = 3.33LGITISPDD286 pKa = 3.14NTDD289 pKa = 3.05LRR291 pKa = 11.84QSVKK295 pKa = 10.12TSIEE299 pKa = 4.25GYY301 pKa = 10.12IKK303 pKa = 9.75TLSPGSTLQLSSVRR317 pKa = 11.84TAIGSTPGVSDD328 pKa = 3.88YY329 pKa = 11.76VLDD332 pKa = 4.46LNADD336 pKa = 3.67VPALSSEE343 pKa = 3.96LHH345 pKa = 5.89ALGVITWGTMM355 pKa = 2.9
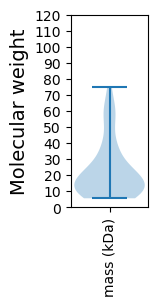
Molecular weight: 38.19 kDa
Isoelectric point according different methods:
Protein with the highest isoelectric point:
>tr|M4M9R2|M4M9R2_9CAUD Transposase OS=Vibrio phage martha 12B12 OX=573175 GN=VPCG_00047 PE=4 SV=1
MM1 pKa = 7.48LLISTRR7 pKa = 11.84YY8 pKa = 10.26GEE10 pKa = 4.48INVSRR15 pKa = 11.84HH16 pKa = 4.92AIEE19 pKa = 4.83RR20 pKa = 11.84SRR22 pKa = 11.84QRR24 pKa = 11.84TGRR27 pKa = 11.84SLPQLVEE34 pKa = 4.2AVAKK38 pKa = 10.66ANRR41 pKa = 11.84PSKK44 pKa = 10.52NRR46 pKa = 11.84LRR48 pKa = 11.84RR49 pKa = 11.84IMKK52 pKa = 10.09CEE54 pKa = 4.21SGWQPKK60 pKa = 10.11RR61 pKa = 11.84ILEE64 pKa = 4.08SDD66 pKa = 3.44CAYY69 pKa = 10.95FLIRR73 pKa = 11.84NNNIVTVYY81 pKa = 10.74DD82 pKa = 3.52KK83 pKa = 11.13RR84 pKa = 11.84KK85 pKa = 9.59EE86 pKa = 4.51GYY88 pKa = 9.25SHH90 pKa = 7.3AA91 pKa = 4.63
MM1 pKa = 7.48LLISTRR7 pKa = 11.84YY8 pKa = 10.26GEE10 pKa = 4.48INVSRR15 pKa = 11.84HH16 pKa = 4.92AIEE19 pKa = 4.83RR20 pKa = 11.84SRR22 pKa = 11.84QRR24 pKa = 11.84TGRR27 pKa = 11.84SLPQLVEE34 pKa = 4.2AVAKK38 pKa = 10.66ANRR41 pKa = 11.84PSKK44 pKa = 10.52NRR46 pKa = 11.84LRR48 pKa = 11.84RR49 pKa = 11.84IMKK52 pKa = 10.09CEE54 pKa = 4.21SGWQPKK60 pKa = 10.11RR61 pKa = 11.84ILEE64 pKa = 4.08SDD66 pKa = 3.44CAYY69 pKa = 10.95FLIRR73 pKa = 11.84NNNIVTVYY81 pKa = 10.74DD82 pKa = 3.52KK83 pKa = 11.13RR84 pKa = 11.84KK85 pKa = 9.59EE86 pKa = 4.51GYY88 pKa = 9.25SHH90 pKa = 7.3AA91 pKa = 4.63
Molecular weight: 10.65 kDa
Isoelectric point according different methods:
Peptides (in silico digests for buttom-up proteomics)
Below you can find in silico digests of the whole proteome with Trypsin, Chymotrypsin, Trypsin+LysC, LysN, ArgC proteases suitable for different mass spec machines.| Try ESI |
 |
|---|
| ChTry ESI |
 |
|---|
| ArgC ESI |
 |
|---|
| LysN ESI |
 |
|---|
| TryLysC ESI |
 |
|---|
| Try MALDI |
 |
|---|
| ChTry MALDI |
 |
|---|
| ArgC MALDI |
 |
|---|
| LysN MALDI |
 |
|---|
| TryLysC MALDI |
 |
|---|
| Try LTQ |
 |
|---|
| ChTry LTQ |
 |
|---|
| ArgC LTQ |
 |
|---|
| LysN LTQ |
 |
|---|
| TryLysC LTQ |
 |
|---|
| Try MSlow |
 |
|---|
| ChTry MSlow |
 |
|---|
| ArgC MSlow |
 |
|---|
| LysN MSlow |
 |
|---|
| TryLysC MSlow |
 |
|---|
| Try MShigh |
 |
|---|
| ChTry MShigh |
 |
|---|
| ArgC MShigh |
 |
|---|
| LysN MShigh |
 |
|---|
| TryLysC MShigh |
 |
|---|
General Statistics
Number of major isoforms |
Number of additional isoforms |
Number of all proteins |
Number of amino acids |
Min. Seq. Length |
Max. Seq. Length |
Avg. Seq. Length |
Avg. Mol. Weight |
|---|---|---|---|---|---|---|---|
0 |
10493 |
50 |
663 |
205.7 |
22.91 |
Amino acid frequency
Ala |
Cys |
Asp |
Glu |
Phe |
Gly |
His |
Ile |
Lys |
Leu |
|---|---|---|---|---|---|---|---|---|---|
8.625 ± 0.344 | 0.915 ± 0.133 |
6.109 ± 0.264 | 7.405 ± 0.378 |
3.336 ± 0.216 | 7.062 ± 0.317 |
1.496 ± 0.185 | 5.346 ± 0.22 |
6.223 ± 0.405 | 8.596 ± 0.273 |
Met |
Asn |
Gln |
Pro |
Arg |
Ser |
Thr |
Val |
Trp |
Tyr |
|---|---|---|---|---|---|---|---|---|---|
2.792 ± 0.168 | 4.632 ± 0.203 |
4.088 ± 0.199 | 4.393 ± 0.225 |
5.251 ± 0.246 | 6.643 ± 0.284 |
5.661 ± 0.302 | 6.919 ± 0.296 |
1.658 ± 0.137 | 2.85 ± 0.225 |
Most of the basic statistics you can see at this page can be downloaded from this CSV file
Proteome-pI is available under Creative Commons Attribution-NoDerivs license, for more details see here
| Reference: Kozlowski LP. Proteome-pI 2.0: Proteome Isoelectric Point Database Update. Nucleic Acids Res. 2021, doi: 10.1093/nar/gkab944 | Contact: Lukasz P. Kozlowski |
