Dialister sp. CAG:357
Taxonomy: cellular organisms; Bacteria; Terrabacteria group; Firmicutes; Negativicutes; Veillonellales; Veillonellaceae; Dialister; environmental samples
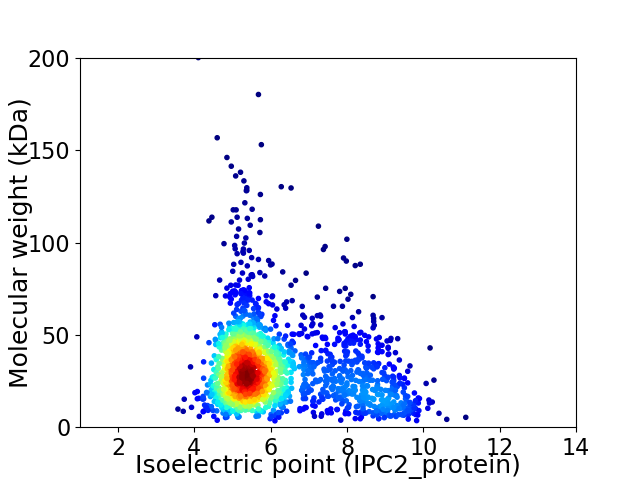
Average proteome isoelectric point is 6.21
Get precalculated fractions of proteins

Virtual 2D-PAGE plot for 1809 proteins (isoelectric point calculated using IPC2_protein)
Get csv file with sequences according to given criteria:
* You can choose from 21 different methods for calculating isoelectric point
Summary statistics related to proteome-wise predictions


Protein with the lowest isoelectric point:
>tr|R7CLP4|R7CLP4_9FIRM DNA repair protein RadC OS=Dialister sp. CAG:357 OX=1262869 GN=BN625_01024 PE=3 SV=1
MM1 pKa = 8.4DD2 pKa = 3.83ITNLQSDD9 pKa = 3.66MDD11 pKa = 4.09YY12 pKa = 11.42LFNCNFFDD20 pKa = 6.0DD21 pKa = 4.71SFDD24 pKa = 4.31PEE26 pKa = 4.26DD27 pKa = 5.18HH28 pKa = 7.33EE29 pKa = 4.8DD30 pKa = 3.66HH31 pKa = 7.16QDD33 pKa = 3.36FADD36 pKa = 4.75KK37 pKa = 10.92VLQSYY42 pKa = 9.79SWDD45 pKa = 3.53EE46 pKa = 3.57IYY48 pKa = 10.86GYY50 pKa = 9.04FFRR53 pKa = 11.84HH54 pKa = 5.66LTQDD58 pKa = 3.26CTTAEE63 pKa = 4.15SVYY66 pKa = 10.92NATNLYY72 pKa = 9.91FVYY75 pKa = 10.38CFDD78 pKa = 4.9KK79 pKa = 11.34NPVPNPYY86 pKa = 10.32EE87 pKa = 3.63LVGYY91 pKa = 9.1VLFRR95 pKa = 11.84IDD97 pKa = 4.54LDD99 pKa = 4.23KK100 pKa = 11.68YY101 pKa = 7.54WDD103 pKa = 3.79EE104 pKa = 4.48YY105 pKa = 11.74GDD107 pKa = 4.58FIDD110 pKa = 4.52SFAVSVLEE118 pKa = 4.01SSKK121 pKa = 10.71KK122 pKa = 9.63VSLMTDD128 pKa = 3.66PYY130 pKa = 9.1YY131 pKa = 11.13APWEE135 pKa = 4.17DD136 pKa = 3.34PKK138 pKa = 11.25VIKK141 pKa = 10.63QMEE144 pKa = 4.16KK145 pKa = 9.72WKK147 pKa = 10.56KK148 pKa = 8.65QLQNNEE154 pKa = 3.53SDD156 pKa = 3.27
MM1 pKa = 8.4DD2 pKa = 3.83ITNLQSDD9 pKa = 3.66MDD11 pKa = 4.09YY12 pKa = 11.42LFNCNFFDD20 pKa = 6.0DD21 pKa = 4.71SFDD24 pKa = 4.31PEE26 pKa = 4.26DD27 pKa = 5.18HH28 pKa = 7.33EE29 pKa = 4.8DD30 pKa = 3.66HH31 pKa = 7.16QDD33 pKa = 3.36FADD36 pKa = 4.75KK37 pKa = 10.92VLQSYY42 pKa = 9.79SWDD45 pKa = 3.53EE46 pKa = 3.57IYY48 pKa = 10.86GYY50 pKa = 9.04FFRR53 pKa = 11.84HH54 pKa = 5.66LTQDD58 pKa = 3.26CTTAEE63 pKa = 4.15SVYY66 pKa = 10.92NATNLYY72 pKa = 9.91FVYY75 pKa = 10.38CFDD78 pKa = 4.9KK79 pKa = 11.34NPVPNPYY86 pKa = 10.32EE87 pKa = 3.63LVGYY91 pKa = 9.1VLFRR95 pKa = 11.84IDD97 pKa = 4.54LDD99 pKa = 4.23KK100 pKa = 11.68YY101 pKa = 7.54WDD103 pKa = 3.79EE104 pKa = 4.48YY105 pKa = 11.74GDD107 pKa = 4.58FIDD110 pKa = 4.52SFAVSVLEE118 pKa = 4.01SSKK121 pKa = 10.71KK122 pKa = 9.63VSLMTDD128 pKa = 3.66PYY130 pKa = 9.1YY131 pKa = 11.13APWEE135 pKa = 4.17DD136 pKa = 3.34PKK138 pKa = 11.25VIKK141 pKa = 10.63QMEE144 pKa = 4.16KK145 pKa = 9.72WKK147 pKa = 10.56KK148 pKa = 8.65QLQNNEE154 pKa = 3.53SDD156 pKa = 3.27
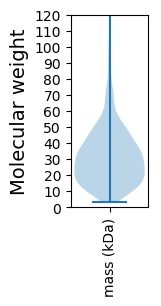
Molecular weight: 18.69 kDa
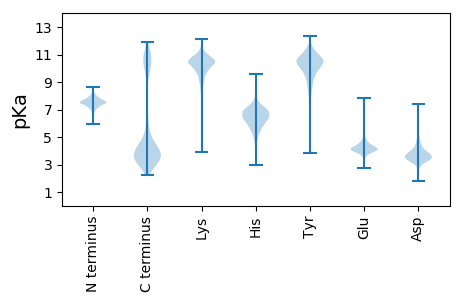
Isoelectric point according different methods:
Protein with the highest isoelectric point:
>tr|R7CRX6|R7CRX6_9FIRM CitMHS domain-containing protein OS=Dialister sp. CAG:357 OX=1262869 GN=BN625_00197 PE=3 SV=1
MM1 pKa = 7.7AKK3 pKa = 7.99MTFQPNNHH11 pKa = 5.63WRR13 pKa = 11.84KK14 pKa = 6.87QTHH17 pKa = 5.61GFRR20 pKa = 11.84ARR22 pKa = 11.84MKK24 pKa = 8.64TKK26 pKa = 10.33AGRR29 pKa = 11.84IVLKK33 pKa = 10.36RR34 pKa = 11.84RR35 pKa = 11.84RR36 pKa = 11.84AKK38 pKa = 9.89GRR40 pKa = 11.84KK41 pKa = 8.67VLSAA45 pKa = 4.05
MM1 pKa = 7.7AKK3 pKa = 7.99MTFQPNNHH11 pKa = 5.63WRR13 pKa = 11.84KK14 pKa = 6.87QTHH17 pKa = 5.61GFRR20 pKa = 11.84ARR22 pKa = 11.84MKK24 pKa = 8.64TKK26 pKa = 10.33AGRR29 pKa = 11.84IVLKK33 pKa = 10.36RR34 pKa = 11.84RR35 pKa = 11.84RR36 pKa = 11.84AKK38 pKa = 9.89GRR40 pKa = 11.84KK41 pKa = 8.67VLSAA45 pKa = 4.05
Molecular weight: 5.35 kDa
Isoelectric point according different methods:
Peptides (in silico digests for buttom-up proteomics)
Below you can find in silico digests of the whole proteome with Trypsin, Chymotrypsin, Trypsin+LysC, LysN, ArgC proteases suitable for different mass spec machines.| Try ESI |
 |
|---|
| ChTry ESI |
 |
|---|
| ArgC ESI |
 |
|---|
| LysN ESI |
 |
|---|
| TryLysC ESI |
 |
|---|
| Try MALDI |
 |
|---|
| ChTry MALDI |
 |
|---|
| ArgC MALDI |
 |
|---|
| LysN MALDI |
 |
|---|
| TryLysC MALDI |
 |
|---|
| Try LTQ |
 |
|---|
| ChTry LTQ |
 |
|---|
| ArgC LTQ |
 |
|---|
| LysN LTQ |
 |
|---|
| TryLysC LTQ |
 |
|---|
| Try MSlow |
 |
|---|
| ChTry MSlow |
 |
|---|
| ArgC MSlow |
 |
|---|
| LysN MSlow |
 |
|---|
| TryLysC MSlow |
 |
|---|
| Try MShigh |
 |
|---|
| ChTry MShigh |
 |
|---|
| ArgC MShigh |
 |
|---|
| LysN MShigh |
 |
|---|
| TryLysC MShigh |
 |
|---|
General Statistics
Number of major isoforms |
Number of additional isoforms |
Number of all proteins |
Number of amino acids |
Min. Seq. Length |
Max. Seq. Length |
Avg. Seq. Length |
Avg. Mol. Weight |
|---|---|---|---|---|---|---|---|
0 |
544003 |
30 |
2013 |
300.7 |
33.39 |
Amino acid frequency
Ala |
Cys |
Asp |
Glu |
Phe |
Gly |
His |
Ile |
Lys |
Leu |
|---|---|---|---|---|---|---|---|---|---|
8.626 ± 0.068 | 1.189 ± 0.021 |
5.888 ± 0.059 | 6.963 ± 0.052 |
4.16 ± 0.044 | 7.732 ± 0.069 |
2.145 ± 0.032 | 7.04 ± 0.043 |
6.526 ± 0.056 | 9.058 ± 0.057 |
Met |
Asn |
Gln |
Pro |
Arg |
Ser |
Thr |
Val |
Trp |
Tyr |
|---|---|---|---|---|---|---|---|---|---|
3.134 ± 0.033 | 3.702 ± 0.04 |
3.907 ± 0.04 | 2.749 ± 0.035 |
4.782 ± 0.055 | 5.829 ± 0.057 |
5.261 ± 0.055 | 6.859 ± 0.046 |
0.967 ± 0.022 | 3.48 ± 0.036 |
Most of the basic statistics you can see at this page can be downloaded from this CSV file
Proteome-pI is available under Creative Commons Attribution-NoDerivs license, for more details see here
| Reference: Kozlowski LP. Proteome-pI 2.0: Proteome Isoelectric Point Database Update. Nucleic Acids Res. 2021, doi: 10.1093/nar/gkab944 | Contact: Lukasz P. Kozlowski |
