Aurantiacibacter xanthus
Taxonomy: cellular organisms; Bacteria; Proteobacteria; Alphaproteobacteria; Sphingomonadales; Erythrobacteraceae; Aurantiacibacter
Average proteome isoelectric point is 6.06
Get precalculated fractions of proteins

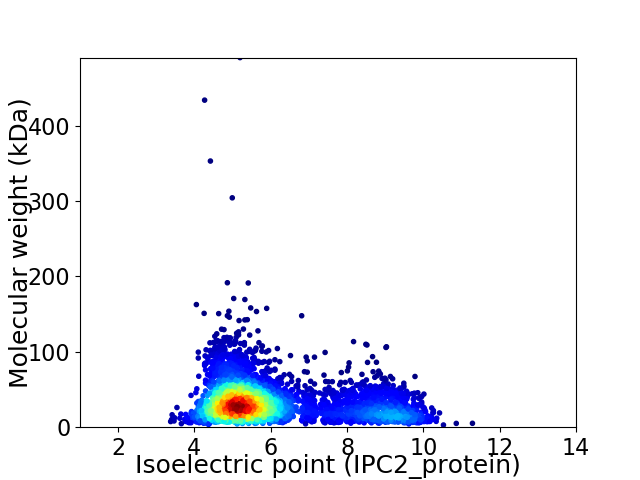
Virtual 2D-PAGE plot for 3955 proteins (isoelectric point calculated using IPC2_protein)
Get csv file with sequences according to given criteria:
* You can choose from 21 different methods for calculating isoelectric point
Summary statistics related to proteome-wise predictions


Protein with the lowest isoelectric point:
>tr|A0A3A1P2H6|A0A3A1P2H6_9SPHN Uncharacterized protein OS=Aurantiacibacter xanthus OX=1784712 GN=D2V17_16855 PE=4 SV=1
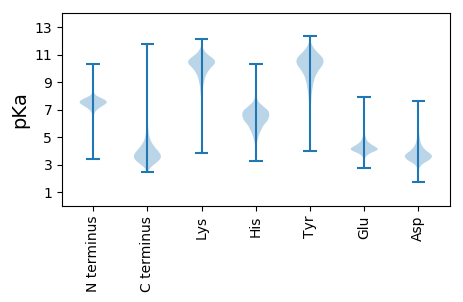
MM1 pKa = 7.76PRR3 pKa = 11.84RR4 pKa = 11.84LHH6 pKa = 6.59QLADD10 pKa = 3.85PNADD14 pKa = 3.48DD15 pKa = 4.08NQFSKK20 pKa = 11.29LLVLLRR26 pKa = 11.84ALQITEE32 pKa = 3.93VSFSLNGGGDD42 pKa = 3.3QGEE45 pKa = 4.28TDD47 pKa = 4.01LDD49 pKa = 3.41HH50 pKa = 7.23VRR52 pKa = 11.84YY53 pKa = 9.67HH54 pKa = 7.56DD55 pKa = 3.55GTEE58 pKa = 3.86NMSIPEE64 pKa = 4.22VPVGIDD70 pKa = 3.22AVGRR74 pKa = 11.84PAMLCYY80 pKa = 10.43ALSEE84 pKa = 4.35FAADD88 pKa = 3.87LPEE91 pKa = 5.68GDD93 pKa = 3.16WCNNEE98 pKa = 3.63GGYY101 pKa = 8.47GTVTIQPFADD111 pKa = 4.34CPCDD115 pKa = 3.89CDD117 pKa = 3.14MTYY120 pKa = 10.62RR121 pKa = 11.84QDD123 pKa = 4.92GDD125 pKa = 3.63WEE127 pKa = 5.48DD128 pKa = 5.54DD129 pKa = 4.62DD130 pKa = 6.05EE131 pKa = 7.35LDD133 pKa = 4.95DD134 pKa = 5.06DD135 pKa = 5.6LEE137 pKa = 5.24AFVLDD142 pKa = 4.98PEE144 pKa = 4.53TAPAGPPAIIIGEE157 pKa = 4.12AQAA160 pKa = 4.4
MM1 pKa = 7.76PRR3 pKa = 11.84RR4 pKa = 11.84LHH6 pKa = 6.59QLADD10 pKa = 3.85PNADD14 pKa = 3.48DD15 pKa = 4.08NQFSKK20 pKa = 11.29LLVLLRR26 pKa = 11.84ALQITEE32 pKa = 3.93VSFSLNGGGDD42 pKa = 3.3QGEE45 pKa = 4.28TDD47 pKa = 4.01LDD49 pKa = 3.41HH50 pKa = 7.23VRR52 pKa = 11.84YY53 pKa = 9.67HH54 pKa = 7.56DD55 pKa = 3.55GTEE58 pKa = 3.86NMSIPEE64 pKa = 4.22VPVGIDD70 pKa = 3.22AVGRR74 pKa = 11.84PAMLCYY80 pKa = 10.43ALSEE84 pKa = 4.35FAADD88 pKa = 3.87LPEE91 pKa = 5.68GDD93 pKa = 3.16WCNNEE98 pKa = 3.63GGYY101 pKa = 8.47GTVTIQPFADD111 pKa = 4.34CPCDD115 pKa = 3.89CDD117 pKa = 3.14MTYY120 pKa = 10.62RR121 pKa = 11.84QDD123 pKa = 4.92GDD125 pKa = 3.63WEE127 pKa = 5.48DD128 pKa = 5.54DD129 pKa = 4.62DD130 pKa = 6.05EE131 pKa = 7.35LDD133 pKa = 4.95DD134 pKa = 5.06DD135 pKa = 5.6LEE137 pKa = 5.24AFVLDD142 pKa = 4.98PEE144 pKa = 4.53TAPAGPPAIIIGEE157 pKa = 4.12AQAA160 pKa = 4.4
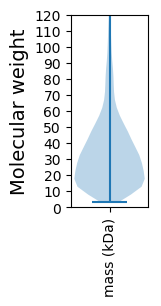
Molecular weight: 17.42 kDa
Isoelectric point according different methods:
Protein with the highest isoelectric point:
>tr|A0A3A1PGA1|A0A3A1PGA1_9SPHN RES domain-containing protein OS=Aurantiacibacter xanthus OX=1784712 GN=D2V17_01075 PE=3 SV=1
MM1 pKa = 7.45KK2 pKa = 9.61RR3 pKa = 11.84TFQPSNLVRR12 pKa = 11.84ARR14 pKa = 11.84RR15 pKa = 11.84HH16 pKa = 4.89GFFARR21 pKa = 11.84KK22 pKa = 8.02ATVGGRR28 pKa = 11.84KK29 pKa = 8.1VLRR32 pKa = 11.84ARR34 pKa = 11.84RR35 pKa = 11.84RR36 pKa = 11.84RR37 pKa = 11.84GRR39 pKa = 11.84NKK41 pKa = 10.39LSAA44 pKa = 3.94
MM1 pKa = 7.45KK2 pKa = 9.61RR3 pKa = 11.84TFQPSNLVRR12 pKa = 11.84ARR14 pKa = 11.84RR15 pKa = 11.84HH16 pKa = 4.89GFFARR21 pKa = 11.84KK22 pKa = 8.02ATVGGRR28 pKa = 11.84KK29 pKa = 8.1VLRR32 pKa = 11.84ARR34 pKa = 11.84RR35 pKa = 11.84RR36 pKa = 11.84RR37 pKa = 11.84GRR39 pKa = 11.84NKK41 pKa = 10.39LSAA44 pKa = 3.94
Molecular weight: 5.17 kDa
Isoelectric point according different methods:
Peptides (in silico digests for buttom-up proteomics)
Below you can find in silico digests of the whole proteome with Trypsin, Chymotrypsin, Trypsin+LysC, LysN, ArgC proteases suitable for different mass spec machines.| Try ESI |
 |
|---|
| ChTry ESI |
 |
|---|
| ArgC ESI |
 |
|---|
| LysN ESI |
 |
|---|
| TryLysC ESI |
 |
|---|
| Try MALDI |
 |
|---|
| ChTry MALDI |
 |
|---|
| ArgC MALDI |
 |
|---|
| LysN MALDI |
 |
|---|
| TryLysC MALDI |
 |
|---|
| Try LTQ |
 |
|---|
| ChTry LTQ |
 |
|---|
| ArgC LTQ |
 |
|---|
| LysN LTQ |
 |
|---|
| TryLysC LTQ |
 |
|---|
| Try MSlow |
 |
|---|
| ChTry MSlow |
 |
|---|
| ArgC MSlow |
 |
|---|
| LysN MSlow |
 |
|---|
| TryLysC MSlow |
 |
|---|
| Try MShigh |
 |
|---|
| ChTry MShigh |
 |
|---|
| ArgC MShigh |
 |
|---|
| LysN MShigh |
 |
|---|
| TryLysC MShigh |
 |
|---|
General Statistics
Number of major isoforms |
Number of additional isoforms |
Number of all proteins |
Number of amino acids |
Min. Seq. Length |
Max. Seq. Length |
Avg. Seq. Length |
Avg. Mol. Weight |
|---|---|---|---|---|---|---|---|
0 |
1287496 |
28 |
4533 |
325.5 |
35.23 |
Amino acid frequency
Ala |
Cys |
Asp |
Glu |
Phe |
Gly |
His |
Ile |
Lys |
Leu |
|---|---|---|---|---|---|---|---|---|---|
12.93 ± 0.057 | 0.842 ± 0.012 |
5.983 ± 0.031 | 6.041 ± 0.042 |
3.615 ± 0.025 | 8.81 ± 0.044 |
1.937 ± 0.025 | 4.78 ± 0.026 |
2.786 ± 0.029 | 9.972 ± 0.043 |
Met |
Asn |
Gln |
Pro |
Arg |
Ser |
Thr |
Val |
Trp |
Tyr |
|---|---|---|---|---|---|---|---|---|---|
2.438 ± 0.021 | 2.652 ± 0.031 |
5.239 ± 0.031 | 3.255 ± 0.021 |
7.073 ± 0.041 | 5.542 ± 0.034 |
5.239 ± 0.045 | 7.112 ± 0.027 |
1.439 ± 0.015 | 2.316 ± 0.023 |
Most of the basic statistics you can see at this page can be downloaded from this CSV file
Proteome-pI is available under Creative Commons Attribution-NoDerivs license, for more details see here
| Reference: Kozlowski LP. Proteome-pI 2.0: Proteome Isoelectric Point Database Update. Nucleic Acids Res. 2021, doi: 10.1093/nar/gkab944 | Contact: Lukasz P. Kozlowski |
