Oscillatoria acuminata PCC 6304
Taxonomy: cellular organisms; Bacteria; Terrabacteria group; Cyanobacteria/Melainabacteria group; Cyanobacteria; Oscillatoriophycideae; Oscillatoriales; Oscillatoriaceae; Oscillatoria; Oscillatoria acuminata
Average proteome isoelectric point is 5.89
Get precalculated fractions of proteins
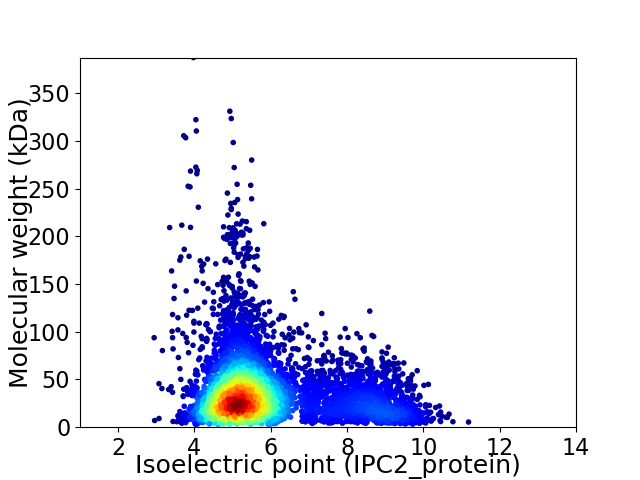
Virtual 2D-PAGE plot for 5755 proteins (isoelectric point calculated using IPC2_protein)
Get csv file with sequences according to given criteria:
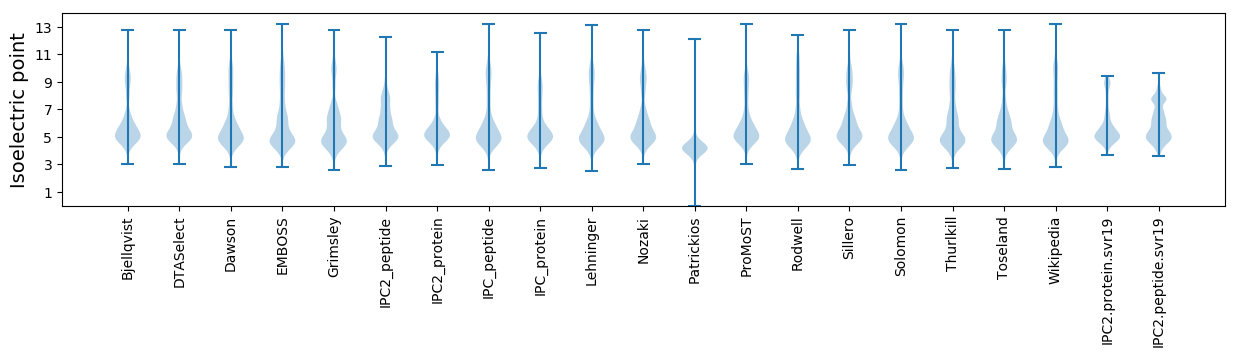
* You can choose from 21 different methods for calculating isoelectric point
Summary statistics related to proteome-wise predictions
Protein with the lowest isoelectric point:
>tr|K9TMM7|K9TMM7_9CYAN Site-specific DNA-methyltransferase (adenine-specific) OS=Oscillatoria acuminata PCC 6304 OX=56110 GN=Oscil6304_4139 PE=3 SV=1
MM1 pKa = 7.18TVFIALNDD9 pKa = 3.72NNTLVAFNANNPTQTSSVGVTGIEE33 pKa = 4.2GTLLGIDD40 pKa = 3.44TRR42 pKa = 11.84PANGLIYY49 pKa = 10.53GITTTNNIYY58 pKa = 10.77SIDD61 pKa = 3.88PQSLGFTIDD70 pKa = 3.98ANGALNNTMTPATVSATLVSTLSQPFEE97 pKa = 4.45GGTVSGVDD105 pKa = 3.99FNPVPDD111 pKa = 3.71RR112 pKa = 11.84LRR114 pKa = 11.84LVGEE118 pKa = 3.9NNQNFRR124 pKa = 11.84INVDD128 pKa = 3.17TGAVIVDD135 pKa = 3.86GTLAFAADD143 pKa = 4.23DD144 pKa = 4.15PNGAVNPTISASGYY158 pKa = 7.43TNSFAGTTSTQLYY171 pKa = 10.76NIDD174 pKa = 3.72TQLNTLLLQNPPNDD188 pKa = 3.77GTLVTIGNLGVDD200 pKa = 4.69FGNLAGFDD208 pKa = 3.52IVSGGMAGEE217 pKa = 3.99NAAFAVANSMLYY229 pKa = 10.63SIDD232 pKa = 3.59LTNGQASSLGMIGGNTGLNVQGLATVPTSTFRR264 pKa = 11.84DD265 pKa = 4.01TITGEE270 pKa = 4.36TEE272 pKa = 3.93FNPAQYY278 pKa = 10.38LASHH282 pKa = 7.79PDD284 pKa = 3.92LIAAFGYY291 pKa = 10.39NLAAAAQHH299 pKa = 6.07YY300 pKa = 10.93DD301 pKa = 3.37MFGMAEE307 pKa = 3.86NRR309 pKa = 11.84ALDD312 pKa = 3.49TFDD315 pKa = 3.25EE316 pKa = 4.27VRR318 pKa = 11.84YY319 pKa = 8.76LASYY323 pKa = 10.75ADD325 pKa = 5.24LIQVIGFNPEE335 pKa = 3.28LATEE339 pKa = 4.17HH340 pKa = 6.18FVVFGADD347 pKa = 3.1EE348 pKa = 4.33GRR350 pKa = 11.84VTNLFNPVNYY360 pKa = 10.28LNTYY364 pKa = 10.04ADD366 pKa = 3.39LRR368 pKa = 11.84AAFGNDD374 pKa = 2.71LMAATQHH381 pKa = 5.94YY382 pKa = 8.65IQNGFDD388 pKa = 3.38EE389 pKa = 4.95GRR391 pKa = 11.84VFF393 pKa = 4.87
MM1 pKa = 7.18TVFIALNDD9 pKa = 3.72NNTLVAFNANNPTQTSSVGVTGIEE33 pKa = 4.2GTLLGIDD40 pKa = 3.44TRR42 pKa = 11.84PANGLIYY49 pKa = 10.53GITTTNNIYY58 pKa = 10.77SIDD61 pKa = 3.88PQSLGFTIDD70 pKa = 3.98ANGALNNTMTPATVSATLVSTLSQPFEE97 pKa = 4.45GGTVSGVDD105 pKa = 3.99FNPVPDD111 pKa = 3.71RR112 pKa = 11.84LRR114 pKa = 11.84LVGEE118 pKa = 3.9NNQNFRR124 pKa = 11.84INVDD128 pKa = 3.17TGAVIVDD135 pKa = 3.86GTLAFAADD143 pKa = 4.23DD144 pKa = 4.15PNGAVNPTISASGYY158 pKa = 7.43TNSFAGTTSTQLYY171 pKa = 10.76NIDD174 pKa = 3.72TQLNTLLLQNPPNDD188 pKa = 3.77GTLVTIGNLGVDD200 pKa = 4.69FGNLAGFDD208 pKa = 3.52IVSGGMAGEE217 pKa = 3.99NAAFAVANSMLYY229 pKa = 10.63SIDD232 pKa = 3.59LTNGQASSLGMIGGNTGLNVQGLATVPTSTFRR264 pKa = 11.84DD265 pKa = 4.01TITGEE270 pKa = 4.36TEE272 pKa = 3.93FNPAQYY278 pKa = 10.38LASHH282 pKa = 7.79PDD284 pKa = 3.92LIAAFGYY291 pKa = 10.39NLAAAAQHH299 pKa = 6.07YY300 pKa = 10.93DD301 pKa = 3.37MFGMAEE307 pKa = 3.86NRR309 pKa = 11.84ALDD312 pKa = 3.49TFDD315 pKa = 3.25EE316 pKa = 4.27VRR318 pKa = 11.84YY319 pKa = 8.76LASYY323 pKa = 10.75ADD325 pKa = 5.24LIQVIGFNPEE335 pKa = 3.28LATEE339 pKa = 4.17HH340 pKa = 6.18FVVFGADD347 pKa = 3.1EE348 pKa = 4.33GRR350 pKa = 11.84VTNLFNPVNYY360 pKa = 10.28LNTYY364 pKa = 10.04ADD366 pKa = 3.39LRR368 pKa = 11.84AAFGNDD374 pKa = 2.71LMAATQHH381 pKa = 5.94YY382 pKa = 8.65IQNGFDD388 pKa = 3.38EE389 pKa = 4.95GRR391 pKa = 11.84VFF393 pKa = 4.87
Molecular weight: 41.42 kDa
Isoelectric point according different methods:
Protein with the highest isoelectric point:
>tr|K9TGF8|K9TGF8_9CYAN Quinolinate phosphoribosyltransferase [decarboxylating] OS=Oscillatoria acuminata PCC 6304 OX=56110 GN=Oscil6304_1800 PE=3 SV=1
MM1 pKa = 6.63TQRR4 pKa = 11.84TLHH7 pKa = 4.82GTSRR11 pKa = 11.84KK12 pKa = 8.94RR13 pKa = 11.84KK14 pKa = 7.72RR15 pKa = 11.84VSGFRR20 pKa = 11.84VRR22 pKa = 11.84MRR24 pKa = 11.84TANGRR29 pKa = 11.84RR30 pKa = 11.84VIKK33 pKa = 10.2SRR35 pKa = 11.84RR36 pKa = 11.84NKK38 pKa = 9.36GRR40 pKa = 11.84YY41 pKa = 8.64RR42 pKa = 11.84LAVV45 pKa = 3.33
MM1 pKa = 6.63TQRR4 pKa = 11.84TLHH7 pKa = 4.82GTSRR11 pKa = 11.84KK12 pKa = 8.94RR13 pKa = 11.84KK14 pKa = 7.72RR15 pKa = 11.84VSGFRR20 pKa = 11.84VRR22 pKa = 11.84MRR24 pKa = 11.84TANGRR29 pKa = 11.84RR30 pKa = 11.84VIKK33 pKa = 10.2SRR35 pKa = 11.84RR36 pKa = 11.84NKK38 pKa = 9.36GRR40 pKa = 11.84YY41 pKa = 8.64RR42 pKa = 11.84LAVV45 pKa = 3.33
Molecular weight: 5.4 kDa
Isoelectric point according different methods:
Peptides (in silico digests for buttom-up proteomics)
Below you can find in silico digests of the whole proteome with Trypsin, Chymotrypsin, Trypsin+LysC, LysN, ArgC proteases suitable for different mass spec machines.| Try ESI |
 |
|---|
| ChTry ESI |
|
|---|
| ArgC ESI |
|
|---|
| LysN ESI |
|
|---|
| TryLysC ESI |
|
|---|
| Try MALDI |
|
|---|
| ChTry MALDI |
|
|---|
| ArgC MALDI |
|
|---|
| LysN MALDI |
|
|---|
| TryLysC MALDI |
|
|---|
| Try LTQ |
|
|---|
| ChTry LTQ |
|
|---|
| ArgC LTQ |
|
|---|
| LysN LTQ |
|
|---|
| TryLysC LTQ |
|
|---|
| Try MSlow |
|
|---|
| ChTry MSlow |
|
|---|
| ArgC MSlow |
|
|---|
| LysN MSlow |
|
|---|
| TryLysC MSlow |
|
|---|
| Try MShigh |
|
|---|
| ChTry MShigh |
|
|---|
| ArgC MShigh |
|
|---|
| LysN MShigh |
|
|---|
| TryLysC MShigh |
|
|---|
General Statistics
Number of major isoforms |
Number of additional isoforms |
Number of all proteins |
Number of amino acids |
Min. Seq. Length |
Max. Seq. Length |
Avg. Seq. Length |
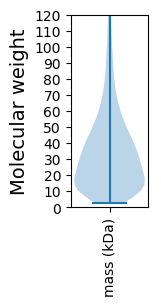
Avg. Mol. Weight |
|---|---|---|---|---|---|---|---|
0 |
2048953 |
23 |
3704 |
356.0 |
39.59 |
Amino acid frequency
Ala |
Cys |
Asp |
Glu |
Phe |
Gly |
His |
Ile |
Lys |
Leu |
|---|---|---|---|---|---|---|---|---|---|
8.1 ± 0.032 | 0.97 ± 0.011 |
5.022 ± 0.03 | 6.881 ± 0.037 |
3.801 ± 0.02 | 7.114 ± 0.049 |
1.818 ± 0.015 | 6.373 ± 0.027 |
3.976 ± 0.033 | 11.058 ± 0.038 |
Met |
Asn |
Gln |
Pro |
Arg |
Ser |
Thr |
Val |
Trp |
Tyr |
|---|---|---|---|---|---|---|---|---|---|
1.896 ± 0.017 | 4.075 ± 0.029 |
5.295 ± 0.031 | 5.471 ± 0.033 |
5.441 ± 0.036 | 6.396 ± 0.024 |
5.719 ± 0.039 | 6.272 ± 0.026 |
1.467 ± 0.013 | 2.856 ± 0.019 |
Most of the basic statistics you can see at this page can be downloaded from this CSV file
See this proteome in:

Proteome-pI is available under Creative Commons Attribution-NoDerivs license, for more details see here
| Reference: Kozlowski LP. Proteome-pI 2.0: Proteome Isoelectric Point Database Update. Nucleic Acids Res. 2021, doi: 10.1093/nar/gkab944 | Contact: Lukasz P. Kozlowski |