Veillonella criceti
Taxonomy: cellular organisms; Bacteria; Terrabacteria group; Firmicutes; Negativicutes; Veillonellales; Veillonellaceae; Veillonella
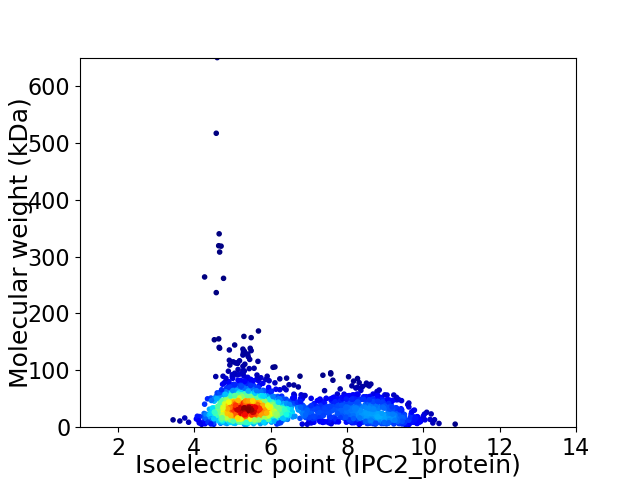
Average proteome isoelectric point is 6.23
Get precalculated fractions of proteins

Virtual 2D-PAGE plot for 1926 proteins (isoelectric point calculated using IPC2_protein)
Get csv file with sequences according to given criteria:
* You can choose from 21 different methods for calculating isoelectric point
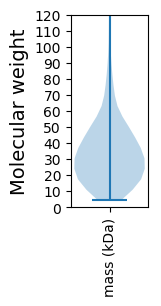
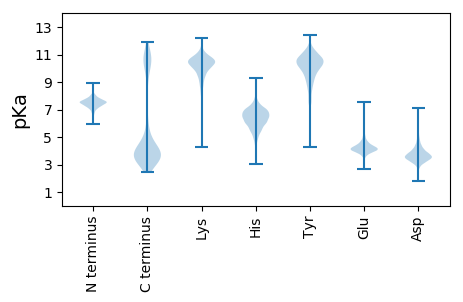
Summary statistics related to proteome-wise predictions


Protein with the lowest isoelectric point:
>tr|A0A380NKL7|A0A380NKL7_9FIRM Uncharacterized protein OS=Veillonella criceti OX=103891 GN=NCTC12020_00733 PE=4 SV=1
MM1 pKa = 7.44QLKK4 pKa = 9.25QWLRR8 pKa = 11.84PFILGFTLQLFIVAVPHH25 pKa = 5.5TAFANWLSFGDD36 pKa = 4.13MYY38 pKa = 11.48AGATSEE44 pKa = 4.35GLILSDD50 pKa = 5.32SLLSLNGQTVTMQGYY65 pKa = 7.43MAPPLKK71 pKa = 10.34PSINFFVLTEE81 pKa = 4.25TPMSICPFCSTDD93 pKa = 3.78ADD95 pKa = 3.83WPSDD99 pKa = 3.33IVVVYY104 pKa = 10.86LDD106 pKa = 4.21DD107 pKa = 4.8AVTALPYY114 pKa = 10.82DD115 pKa = 3.36QDD117 pKa = 3.44ITVTGQLDD125 pKa = 3.35VGSYY129 pKa = 11.08VDD131 pKa = 4.13GEE133 pKa = 4.57TGFVSLVRR141 pKa = 11.84LLGSEE146 pKa = 4.76VYY148 pKa = 10.52
MM1 pKa = 7.44QLKK4 pKa = 9.25QWLRR8 pKa = 11.84PFILGFTLQLFIVAVPHH25 pKa = 5.5TAFANWLSFGDD36 pKa = 4.13MYY38 pKa = 11.48AGATSEE44 pKa = 4.35GLILSDD50 pKa = 5.32SLLSLNGQTVTMQGYY65 pKa = 7.43MAPPLKK71 pKa = 10.34PSINFFVLTEE81 pKa = 4.25TPMSICPFCSTDD93 pKa = 3.78ADD95 pKa = 3.83WPSDD99 pKa = 3.33IVVVYY104 pKa = 10.86LDD106 pKa = 4.21DD107 pKa = 4.8AVTALPYY114 pKa = 10.82DD115 pKa = 3.36QDD117 pKa = 3.44ITVTGQLDD125 pKa = 3.35VGSYY129 pKa = 11.08VDD131 pKa = 4.13GEE133 pKa = 4.57TGFVSLVRR141 pKa = 11.84LLGSEE146 pKa = 4.76VYY148 pKa = 10.52
Molecular weight: 16.2 kDa
Isoelectric point according different methods:
Protein with the highest isoelectric point:
>tr|A0A380NM51|A0A380NM51_9FIRM Response regulator ArlR OS=Veillonella criceti OX=103891 GN=arlR PE=4 SV=1
MM1 pKa = 6.79YY2 pKa = 9.92RR3 pKa = 11.84KK4 pKa = 10.09AILDD8 pKa = 3.79SQTSIHH14 pKa = 6.52APRR17 pKa = 11.84MRR19 pKa = 11.84SDD21 pKa = 3.6CNRR24 pKa = 11.84ARR26 pKa = 11.84RR27 pKa = 11.84LTSQGDD33 pKa = 3.6FNPRR37 pKa = 11.84SPNEE41 pKa = 3.76EE42 pKa = 3.68RR43 pKa = 11.84QGHH46 pKa = 5.05HH47 pKa = 6.52RR48 pKa = 11.84RR49 pKa = 11.84RR50 pKa = 11.84APRR53 pKa = 11.84GDD55 pKa = 3.59TSIHH59 pKa = 5.83APRR62 pKa = 11.84MRR64 pKa = 11.84SDD66 pKa = 3.47KK67 pKa = 10.96EE68 pKa = 3.97EE69 pKa = 4.46KK70 pKa = 10.3EE71 pKa = 4.02LLKK74 pKa = 11.03DD75 pKa = 4.45FINFNPRR82 pKa = 11.84SPNEE86 pKa = 3.59EE87 pKa = 3.79RR88 pKa = 11.84LEE90 pKa = 4.02KK91 pKa = 10.36FLNDD95 pKa = 3.57GEE97 pKa = 4.71VTFTSIHH104 pKa = 5.95APRR107 pKa = 11.84MRR109 pKa = 11.84SDD111 pKa = 3.4NPPIIRR117 pKa = 11.84ICTHH121 pKa = 6.55KK122 pKa = 10.63YY123 pKa = 9.66FNPRR127 pKa = 11.84SPNEE131 pKa = 3.68EE132 pKa = 3.55RR133 pKa = 11.84RR134 pKa = 11.84PRR136 pKa = 11.84LPHH139 pKa = 4.75EE140 pKa = 4.3HH141 pKa = 6.78RR142 pKa = 4.84
MM1 pKa = 6.79YY2 pKa = 9.92RR3 pKa = 11.84KK4 pKa = 10.09AILDD8 pKa = 3.79SQTSIHH14 pKa = 6.52APRR17 pKa = 11.84MRR19 pKa = 11.84SDD21 pKa = 3.6CNRR24 pKa = 11.84ARR26 pKa = 11.84RR27 pKa = 11.84LTSQGDD33 pKa = 3.6FNPRR37 pKa = 11.84SPNEE41 pKa = 3.76EE42 pKa = 3.68RR43 pKa = 11.84QGHH46 pKa = 5.05HH47 pKa = 6.52RR48 pKa = 11.84RR49 pKa = 11.84RR50 pKa = 11.84APRR53 pKa = 11.84GDD55 pKa = 3.59TSIHH59 pKa = 5.83APRR62 pKa = 11.84MRR64 pKa = 11.84SDD66 pKa = 3.47KK67 pKa = 10.96EE68 pKa = 3.97EE69 pKa = 4.46KK70 pKa = 10.3EE71 pKa = 4.02LLKK74 pKa = 11.03DD75 pKa = 4.45FINFNPRR82 pKa = 11.84SPNEE86 pKa = 3.59EE87 pKa = 3.79RR88 pKa = 11.84LEE90 pKa = 4.02KK91 pKa = 10.36FLNDD95 pKa = 3.57GEE97 pKa = 4.71VTFTSIHH104 pKa = 5.95APRR107 pKa = 11.84MRR109 pKa = 11.84SDD111 pKa = 3.4NPPIIRR117 pKa = 11.84ICTHH121 pKa = 6.55KK122 pKa = 10.63YY123 pKa = 9.66FNPRR127 pKa = 11.84SPNEE131 pKa = 3.68EE132 pKa = 3.55RR133 pKa = 11.84RR134 pKa = 11.84PRR136 pKa = 11.84LPHH139 pKa = 4.75EE140 pKa = 4.3HH141 pKa = 6.78RR142 pKa = 4.84
Molecular weight: 16.94 kDa
Isoelectric point according different methods:
Peptides (in silico digests for buttom-up proteomics)
Below you can find in silico digests of the whole proteome with Trypsin, Chymotrypsin, Trypsin+LysC, LysN, ArgC proteases suitable for different mass spec machines.| Try ESI |
 |
|---|
| ChTry ESI |
 |
|---|
| ArgC ESI |
 |
|---|
| LysN ESI |
 |
|---|
| TryLysC ESI |
 |
|---|
| Try MALDI |
 |
|---|
| ChTry MALDI |
 |
|---|
| ArgC MALDI |
 |
|---|
| LysN MALDI |
 |
|---|
| TryLysC MALDI |
 |
|---|
| Try LTQ |
 |
|---|
| ChTry LTQ |
 |
|---|
| ArgC LTQ |
 |
|---|
| LysN LTQ |
 |
|---|
| TryLysC LTQ |
 |
|---|
| Try MSlow |
 |
|---|
| ChTry MSlow |
 |
|---|
| ArgC MSlow |
 |
|---|
| LysN MSlow |
 |
|---|
| TryLysC MSlow |
 |
|---|
| Try MShigh |
 |
|---|
| ChTry MShigh |
 |
|---|
| ArgC MShigh |
 |
|---|
| LysN MShigh |
 |
|---|
| TryLysC MShigh |
 |
|---|
General Statistics
Number of major isoforms |
Number of additional isoforms |
Number of all proteins |
Number of amino acids |
Min. Seq. Length |
Max. Seq. Length |
Avg. Seq. Length |
Avg. Mol. Weight |
|---|---|---|---|---|---|---|---|
0 |
638175 |
37 |
6487 |
331.3 |
36.58 |
Amino acid frequency
Ala |
Cys |
Asp |
Glu |
Phe |
Gly |
His |
Ile |
Lys |
Leu |
|---|---|---|---|---|---|---|---|---|---|
8.693 ± 0.067 | 0.969 ± 0.024 |
5.329 ± 0.06 | 6.511 ± 0.068 |
3.758 ± 0.052 | 7.753 ± 0.101 |
1.988 ± 0.029 | 7.132 ± 0.057 |
5.982 ± 0.044 | 9.362 ± 0.08 |
Met |
Asn |
Gln |
Pro |
Arg |
Ser |
Thr |
Val |
Trp |
Tyr |
|---|---|---|---|---|---|---|---|---|---|
2.784 ± 0.041 | 4.284 ± 0.071 |
3.671 ± 0.035 | 3.595 ± 0.037 |
4.292 ± 0.059 | 5.492 ± 0.044 |
6.247 ± 0.08 | 7.722 ± 0.056 |
0.959 ± 0.02 | 3.476 ± 0.05 |
Most of the basic statistics you can see at this page can be downloaded from this CSV file
Proteome-pI is available under Creative Commons Attribution-NoDerivs license, for more details see here
| Reference: Kozlowski LP. Proteome-pI 2.0: Proteome Isoelectric Point Database Update. Nucleic Acids Res. 2021, doi: 10.1093/nar/gkab944 | Contact: Lukasz P. Kozlowski |
