Halocynthiibacter arcticus
Taxonomy: cellular organisms; Bacteria; Proteobacteria; Alphaproteobacteria; Rhodobacterales; Rhodobacteraceae; Halocynthiibacter
Average proteome isoelectric point is 6.22
Get precalculated fractions of proteins

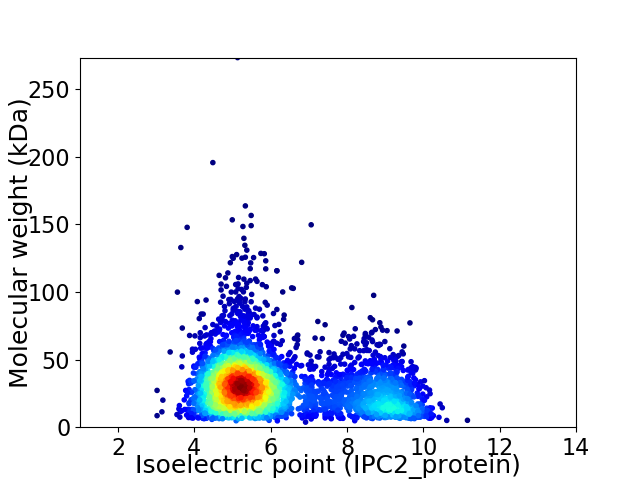
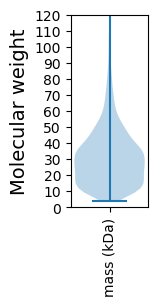
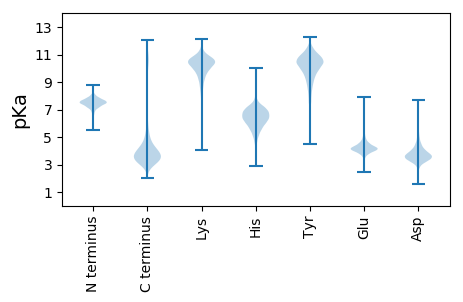
Virtual 2D-PAGE plot for 3882 proteins (isoelectric point calculated using IPC2_protein)
Get csv file with sequences according to given criteria:
* You can choose from 21 different methods for calculating isoelectric point
Summary statistics related to proteome-wise predictions


Protein with the lowest isoelectric point:
>tr|A0A126V1L2|A0A126V1L2_9RHOB Putrescine-binding periplasmic protein OS=Halocynthiibacter arcticus OX=1579316 GN=RC74_13690 PE=3 SV=1
MM1 pKa = 7.5KK2 pKa = 10.64LKK4 pKa = 8.13TTLVGALIASTCLAGMAAAQTDD26 pKa = 3.11ITMWYY31 pKa = 9.0HH32 pKa = 5.71GGGNEE37 pKa = 4.7VEE39 pKa = 4.42SALINQIVSDD49 pKa = 4.49FNAANADD56 pKa = 3.53YY57 pKa = 10.63DD58 pKa = 3.89VSLEE62 pKa = 4.02SFPQGSYY69 pKa = 10.57NDD71 pKa = 3.99SVVAAALAGNLPDD84 pKa = 5.57IIDD87 pKa = 3.24VDD89 pKa = 4.61GPVMPNWAWANYY101 pKa = 6.47MQPLSIDD108 pKa = 3.33EE109 pKa = 4.74SIIADD114 pKa = 4.32FLPGTIGRR122 pKa = 11.84WDD124 pKa = 3.58GEE126 pKa = 4.44LYY128 pKa = 10.89SVGLWDD134 pKa = 4.76AAVSLYY140 pKa = 10.84ARR142 pKa = 11.84QSTLDD147 pKa = 3.89EE148 pKa = 4.55LSLRR152 pKa = 11.84APTLASPWTKK162 pKa = 11.07DD163 pKa = 2.94EE164 pKa = 4.55FMGALEE170 pKa = 4.09AAKK173 pKa = 10.56ASGKK177 pKa = 10.1CEE179 pKa = 3.66YY180 pKa = 11.13AFDD183 pKa = 5.01VGMAWTGEE191 pKa = 3.91WYY193 pKa = 9.24PYY195 pKa = 10.83AFSPFLQSFGGDD207 pKa = 2.53IVDD210 pKa = 3.72RR211 pKa = 11.84STYY214 pKa = 8.3QTAEE218 pKa = 3.77GALNGDD224 pKa = 3.75AAIEE228 pKa = 4.07FGEE231 pKa = 4.16WWQSLFTEE239 pKa = 6.29GYY241 pKa = 8.61TPGTSQDD248 pKa = 3.37PADD251 pKa = 5.0RR252 pKa = 11.84DD253 pKa = 3.62TGFIDD258 pKa = 4.73GKK260 pKa = 11.16YY261 pKa = 9.1CFSWNGNWASVAAIDD276 pKa = 5.1GGVDD280 pKa = 4.21DD281 pKa = 5.8IVFLPAPDD289 pKa = 4.33FGNGSVIGAGSWQFGISATSEE310 pKa = 3.88NAEE313 pKa = 3.93GANAFIEE320 pKa = 4.65FALQDD325 pKa = 3.29KK326 pKa = 10.56YY327 pKa = 10.8MAAFSDD333 pKa = 4.99GIGLIPSTTSAADD346 pKa = 3.15MTEE349 pKa = 4.32NYY351 pKa = 10.32AQGGPLNIYY360 pKa = 9.44FALSAEE366 pKa = 4.25QALVRR371 pKa = 11.84PVSPGYY377 pKa = 10.29VVAAKK382 pKa = 10.53VFEE385 pKa = 4.31KK386 pKa = 10.98ALADD390 pKa = 3.53IANGADD396 pKa = 3.38VADD399 pKa = 4.21TLDD402 pKa = 3.73AAVDD406 pKa = 4.3EE407 pKa = 4.81IDD409 pKa = 3.54TDD411 pKa = 3.54IEE413 pKa = 4.33RR414 pKa = 11.84NSGYY418 pKa = 11.02GHH420 pKa = 7.45
MM1 pKa = 7.5KK2 pKa = 10.64LKK4 pKa = 8.13TTLVGALIASTCLAGMAAAQTDD26 pKa = 3.11ITMWYY31 pKa = 9.0HH32 pKa = 5.71GGGNEE37 pKa = 4.7VEE39 pKa = 4.42SALINQIVSDD49 pKa = 4.49FNAANADD56 pKa = 3.53YY57 pKa = 10.63DD58 pKa = 3.89VSLEE62 pKa = 4.02SFPQGSYY69 pKa = 10.57NDD71 pKa = 3.99SVVAAALAGNLPDD84 pKa = 5.57IIDD87 pKa = 3.24VDD89 pKa = 4.61GPVMPNWAWANYY101 pKa = 6.47MQPLSIDD108 pKa = 3.33EE109 pKa = 4.74SIIADD114 pKa = 4.32FLPGTIGRR122 pKa = 11.84WDD124 pKa = 3.58GEE126 pKa = 4.44LYY128 pKa = 10.89SVGLWDD134 pKa = 4.76AAVSLYY140 pKa = 10.84ARR142 pKa = 11.84QSTLDD147 pKa = 3.89EE148 pKa = 4.55LSLRR152 pKa = 11.84APTLASPWTKK162 pKa = 11.07DD163 pKa = 2.94EE164 pKa = 4.55FMGALEE170 pKa = 4.09AAKK173 pKa = 10.56ASGKK177 pKa = 10.1CEE179 pKa = 3.66YY180 pKa = 11.13AFDD183 pKa = 5.01VGMAWTGEE191 pKa = 3.91WYY193 pKa = 9.24PYY195 pKa = 10.83AFSPFLQSFGGDD207 pKa = 2.53IVDD210 pKa = 3.72RR211 pKa = 11.84STYY214 pKa = 8.3QTAEE218 pKa = 3.77GALNGDD224 pKa = 3.75AAIEE228 pKa = 4.07FGEE231 pKa = 4.16WWQSLFTEE239 pKa = 6.29GYY241 pKa = 8.61TPGTSQDD248 pKa = 3.37PADD251 pKa = 5.0RR252 pKa = 11.84DD253 pKa = 3.62TGFIDD258 pKa = 4.73GKK260 pKa = 11.16YY261 pKa = 9.1CFSWNGNWASVAAIDD276 pKa = 5.1GGVDD280 pKa = 4.21DD281 pKa = 5.8IVFLPAPDD289 pKa = 4.33FGNGSVIGAGSWQFGISATSEE310 pKa = 3.88NAEE313 pKa = 3.93GANAFIEE320 pKa = 4.65FALQDD325 pKa = 3.29KK326 pKa = 10.56YY327 pKa = 10.8MAAFSDD333 pKa = 4.99GIGLIPSTTSAADD346 pKa = 3.15MTEE349 pKa = 4.32NYY351 pKa = 10.32AQGGPLNIYY360 pKa = 9.44FALSAEE366 pKa = 4.25QALVRR371 pKa = 11.84PVSPGYY377 pKa = 10.29VVAAKK382 pKa = 10.53VFEE385 pKa = 4.31KK386 pKa = 10.98ALADD390 pKa = 3.53IANGADD396 pKa = 3.38VADD399 pKa = 4.21TLDD402 pKa = 3.73AAVDD406 pKa = 4.3EE407 pKa = 4.81IDD409 pKa = 3.54TDD411 pKa = 3.54IEE413 pKa = 4.33RR414 pKa = 11.84NSGYY418 pKa = 11.02GHH420 pKa = 7.45
Molecular weight: 44.64 kDa
Isoelectric point according different methods:
Protein with the highest isoelectric point:
>tr|A0A126UY85|A0A126UY85_9RHOB Uncharacterized protein OS=Halocynthiibacter arcticus OX=1579316 GN=RC74_06675 PE=4 SV=1
MM1 pKa = 7.45KK2 pKa = 9.61RR3 pKa = 11.84TFQPSNLVRR12 pKa = 11.84KK13 pKa = 8.63HH14 pKa = 4.56RR15 pKa = 11.84HH16 pKa = 4.08GFRR19 pKa = 11.84SRR21 pKa = 11.84MATKK25 pKa = 10.43AGRR28 pKa = 11.84NILNARR34 pKa = 11.84RR35 pKa = 11.84AKK37 pKa = 10.02GRR39 pKa = 11.84KK40 pKa = 8.91SLSAA44 pKa = 3.86
MM1 pKa = 7.45KK2 pKa = 9.61RR3 pKa = 11.84TFQPSNLVRR12 pKa = 11.84KK13 pKa = 8.63HH14 pKa = 4.56RR15 pKa = 11.84HH16 pKa = 4.08GFRR19 pKa = 11.84SRR21 pKa = 11.84MATKK25 pKa = 10.43AGRR28 pKa = 11.84NILNARR34 pKa = 11.84RR35 pKa = 11.84AKK37 pKa = 10.02GRR39 pKa = 11.84KK40 pKa = 8.91SLSAA44 pKa = 3.86
Molecular weight: 5.09 kDa
Isoelectric point according different methods:
Peptides (in silico digests for buttom-up proteomics)
Below you can find in silico digests of the whole proteome with Trypsin, Chymotrypsin, Trypsin+LysC, LysN, ArgC proteases suitable for different mass spec machines.| Try ESI |
 |
|---|
| ChTry ESI |
 |
|---|
| ArgC ESI |
 |
|---|
| LysN ESI |
 |
|---|
| TryLysC ESI |
 |
|---|
| Try MALDI |
 |
|---|
| ChTry MALDI |
 |
|---|
| ArgC MALDI |
 |
|---|
| LysN MALDI |
 |
|---|
| TryLysC MALDI |
 |
|---|
| Try LTQ |
 |
|---|
| ChTry LTQ |
 |
|---|
| ArgC LTQ |
 |
|---|
| LysN LTQ |
 |
|---|
| TryLysC LTQ |
 |
|---|
| Try MSlow |
 |
|---|
| ChTry MSlow |
 |
|---|
| ArgC MSlow |
 |
|---|
| LysN MSlow |
 |
|---|
| TryLysC MSlow |
 |
|---|
| Try MShigh |
 |
|---|
| ChTry MShigh |
 |
|---|
| ArgC MShigh |
 |
|---|
| LysN MShigh |
 |
|---|
| TryLysC MShigh |
 |
|---|
General Statistics
Number of major isoforms |
Number of additional isoforms |
Number of all proteins |
Number of amino acids |
Min. Seq. Length |
Max. Seq. Length |
Avg. Seq. Length |
Avg. Mol. Weight |
|---|---|---|---|---|---|---|---|
0 |
1158560 |
37 |
2470 |
298.4 |
32.56 |
Amino acid frequency
Ala |
Cys |
Asp |
Glu |
Phe |
Gly |
His |
Ile |
Lys |
Leu |
|---|---|---|---|---|---|---|---|---|---|
11.083 ± 0.047 | 0.918 ± 0.013 |
5.746 ± 0.027 | 5.926 ± 0.037 |
4.048 ± 0.025 | 8.068 ± 0.035 |
2.003 ± 0.018 | 5.855 ± 0.025 |
3.988 ± 0.033 | 9.967 ± 0.042 |
Met |
Asn |
Gln |
Pro |
Arg |
Ser |
Thr |
Val |
Trp |
Tyr |
|---|---|---|---|---|---|---|---|---|---|
2.761 ± 0.021 | 3.182 ± 0.019 |
4.688 ± 0.027 | 3.315 ± 0.024 |
5.839 ± 0.033 | 5.968 ± 0.03 |
5.746 ± 0.03 | 7.26 ± 0.035 |
1.306 ± 0.015 | 2.333 ± 0.02 |
Most of the basic statistics you can see at this page can be downloaded from this CSV file
Proteome-pI is available under Creative Commons Attribution-NoDerivs license, for more details see here
| Reference: Kozlowski LP. Proteome-pI 2.0: Proteome Isoelectric Point Database Update. Nucleic Acids Res. 2021, doi: 10.1093/nar/gkab944 | Contact: Lukasz P. Kozlowski |
