Streptococcus phage Javan126
Taxonomy: Viruses; Duplodnaviria; Heunggongvirae; Uroviricota; Caudoviricetes; Caudovirales; Siphoviridae; unclassified Siphoviridae
Average proteome isoelectric point is 6.28
Get precalculated fractions of proteins

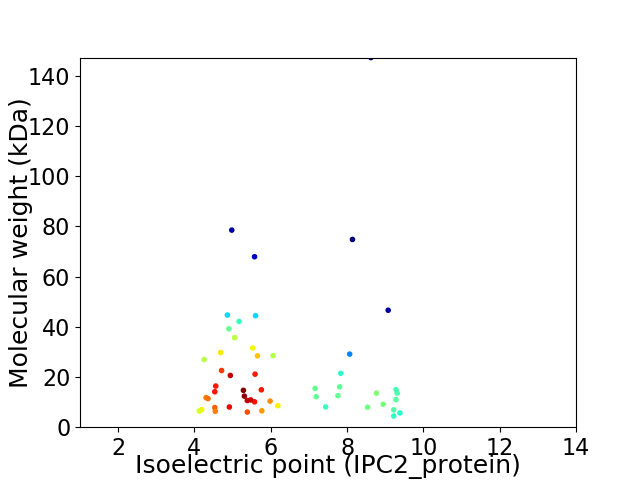
Virtual 2D-PAGE plot for 53 proteins (isoelectric point calculated using IPC2_protein)
Get csv file with sequences according to given criteria:
* You can choose from 21 different methods for calculating isoelectric point
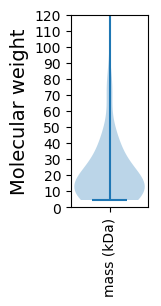
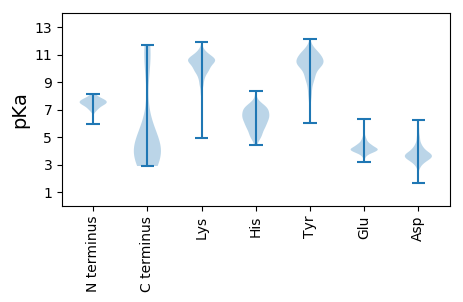
Summary statistics related to proteome-wise predictions


Protein with the lowest isoelectric point:
>tr|A0A4D6AQI0|A0A4D6AQI0_9CAUD HTH cro/C1-type domain-containing protein OS=Streptococcus phage Javan126 OX=2547992 GN=Javan126_0008 PE=4 SV=1
MM1 pKa = 7.26ATLDD5 pKa = 3.84EE6 pKa = 4.51VLSFAKK12 pKa = 10.53GLADD16 pKa = 3.48TGQGVDD22 pKa = 3.78LDD24 pKa = 4.08NVYY27 pKa = 8.53GTQCVDD33 pKa = 3.5LPNWITTKK41 pKa = 10.75YY42 pKa = 10.5FGIALWGNAIDD53 pKa = 5.11LLDD56 pKa = 3.86SAAAQGMEE64 pKa = 4.21VVYY67 pKa = 10.3NAPGVNPRR75 pKa = 11.84AGAIFVMVTYY85 pKa = 10.75AHH87 pKa = 7.21GYY89 pKa = 7.86GHH91 pKa = 7.1TGLVIVTSDD100 pKa = 3.56GYY102 pKa = 10.61VLHH105 pKa = 7.03NIEE108 pKa = 4.75QNVDD112 pKa = 3.04GNADD116 pKa = 3.33ALYY119 pKa = 9.95IGGPARR125 pKa = 11.84YY126 pKa = 9.17VDD128 pKa = 4.39RR129 pKa = 11.84PFEE132 pKa = 5.2DD133 pKa = 3.37GTGYY137 pKa = 10.44ILGWFYY143 pKa = 10.79PPYY146 pKa = 10.6DD147 pKa = 4.01STPAAATEE155 pKa = 3.99PSAPVVAQSDD165 pKa = 3.67GTYY168 pKa = 10.39VVNPEE173 pKa = 3.95TGTFTVRR180 pKa = 11.84VAALNVRR187 pKa = 11.84SAPRR191 pKa = 11.84LDD193 pKa = 3.6AEE195 pKa = 4.28IVATYY200 pKa = 11.02GEE202 pKa = 4.32NTEE205 pKa = 4.2FNYY208 pKa = 10.93DD209 pKa = 2.91GWIDD213 pKa = 3.51SDD215 pKa = 4.15GYY217 pKa = 10.69IWVTYY222 pKa = 10.35ISVTGVRR229 pKa = 11.84RR230 pKa = 11.84YY231 pKa = 9.74VAVGNSQNGRR241 pKa = 11.84RR242 pKa = 11.84VTNFGTFRR250 pKa = 4.37
MM1 pKa = 7.26ATLDD5 pKa = 3.84EE6 pKa = 4.51VLSFAKK12 pKa = 10.53GLADD16 pKa = 3.48TGQGVDD22 pKa = 3.78LDD24 pKa = 4.08NVYY27 pKa = 8.53GTQCVDD33 pKa = 3.5LPNWITTKK41 pKa = 10.75YY42 pKa = 10.5FGIALWGNAIDD53 pKa = 5.11LLDD56 pKa = 3.86SAAAQGMEE64 pKa = 4.21VVYY67 pKa = 10.3NAPGVNPRR75 pKa = 11.84AGAIFVMVTYY85 pKa = 10.75AHH87 pKa = 7.21GYY89 pKa = 7.86GHH91 pKa = 7.1TGLVIVTSDD100 pKa = 3.56GYY102 pKa = 10.61VLHH105 pKa = 7.03NIEE108 pKa = 4.75QNVDD112 pKa = 3.04GNADD116 pKa = 3.33ALYY119 pKa = 9.95IGGPARR125 pKa = 11.84YY126 pKa = 9.17VDD128 pKa = 4.39RR129 pKa = 11.84PFEE132 pKa = 5.2DD133 pKa = 3.37GTGYY137 pKa = 10.44ILGWFYY143 pKa = 10.79PPYY146 pKa = 10.6DD147 pKa = 4.01STPAAATEE155 pKa = 3.99PSAPVVAQSDD165 pKa = 3.67GTYY168 pKa = 10.39VVNPEE173 pKa = 3.95TGTFTVRR180 pKa = 11.84VAALNVRR187 pKa = 11.84SAPRR191 pKa = 11.84LDD193 pKa = 3.6AEE195 pKa = 4.28IVATYY200 pKa = 11.02GEE202 pKa = 4.32NTEE205 pKa = 4.2FNYY208 pKa = 10.93DD209 pKa = 2.91GWIDD213 pKa = 3.51SDD215 pKa = 4.15GYY217 pKa = 10.69IWVTYY222 pKa = 10.35ISVTGVRR229 pKa = 11.84RR230 pKa = 11.84YY231 pKa = 9.74VAVGNSQNGRR241 pKa = 11.84RR242 pKa = 11.84VTNFGTFRR250 pKa = 4.37
Molecular weight: 26.97 kDa
Isoelectric point according different methods:
Protein with the highest isoelectric point:
>tr|A0A4D6ATI1|A0A4D6ATI1_9CAUD Uncharacterized protein OS=Streptococcus phage Javan126 OX=2547992 GN=Javan126_0026 PE=4 SV=1
MM1 pKa = 6.82TTDD4 pKa = 4.11EE5 pKa = 4.69LLQNLRR11 pKa = 11.84DD12 pKa = 4.16DD13 pKa = 4.59LNKK16 pKa = 10.2IMNVLKK22 pKa = 10.73NDD24 pKa = 3.12WKK26 pKa = 11.23ALLFLAIAIFGMMVTVSYY44 pKa = 10.2FSYY47 pKa = 10.7RR48 pKa = 11.84DD49 pKa = 3.12ARR51 pKa = 11.84QYY53 pKa = 11.17YY54 pKa = 8.38EE55 pKa = 3.72PQIYY59 pKa = 9.99GLRR62 pKa = 11.84AQLSRR67 pKa = 11.84TQKK70 pKa = 8.3QLKK73 pKa = 9.28RR74 pKa = 11.84ASEE77 pKa = 3.86QNQRR81 pKa = 11.84QTKK84 pKa = 10.05RR85 pKa = 11.84IAEE88 pKa = 4.08LTGNGGG94 pKa = 3.26
MM1 pKa = 6.82TTDD4 pKa = 4.11EE5 pKa = 4.69LLQNLRR11 pKa = 11.84DD12 pKa = 4.16DD13 pKa = 4.59LNKK16 pKa = 10.2IMNVLKK22 pKa = 10.73NDD24 pKa = 3.12WKK26 pKa = 11.23ALLFLAIAIFGMMVTVSYY44 pKa = 10.2FSYY47 pKa = 10.7RR48 pKa = 11.84DD49 pKa = 3.12ARR51 pKa = 11.84QYY53 pKa = 11.17YY54 pKa = 8.38EE55 pKa = 3.72PQIYY59 pKa = 9.99GLRR62 pKa = 11.84AQLSRR67 pKa = 11.84TQKK70 pKa = 8.3QLKK73 pKa = 9.28RR74 pKa = 11.84ASEE77 pKa = 3.86QNQRR81 pKa = 11.84QTKK84 pKa = 10.05RR85 pKa = 11.84IAEE88 pKa = 4.08LTGNGGG94 pKa = 3.26
Molecular weight: 10.99 kDa
Isoelectric point according different methods:
Peptides (in silico digests for buttom-up proteomics)
Below you can find in silico digests of the whole proteome with Trypsin, Chymotrypsin, Trypsin+LysC, LysN, ArgC proteases suitable for different mass spec machines.| Try ESI |
 |
|---|
| ChTry ESI |
 |
|---|
| ArgC ESI |
 |
|---|
| LysN ESI |
 |
|---|
| TryLysC ESI |
 |
|---|
| Try MALDI |
 |
|---|
| ChTry MALDI |
 |
|---|
| ArgC MALDI |
 |
|---|
| LysN MALDI |
 |
|---|
| TryLysC MALDI |
 |
|---|
| Try LTQ |
 |
|---|
| ChTry LTQ |
 |
|---|
| ArgC LTQ |
 |
|---|
| LysN LTQ |
 |
|---|
| TryLysC LTQ |
 |
|---|
| Try MSlow |
 |
|---|
| ChTry MSlow |
 |
|---|
| ArgC MSlow |
 |
|---|
| LysN MSlow |
 |
|---|
| TryLysC MSlow |
 |
|---|
| Try MShigh |
 |
|---|
| ChTry MShigh |
 |
|---|
| ArgC MShigh |
 |
|---|
| LysN MShigh |
 |
|---|
| TryLysC MShigh |
 |
|---|
General Statistics
Number of major isoforms |
Number of additional isoforms |
Number of all proteins |
Number of amino acids |
Min. Seq. Length |
Max. Seq. Length |
Avg. Seq. Length |
Avg. Mol. Weight |
|---|---|---|---|---|---|---|---|
0 |
10807 |
38 |
1366 |
203.9 |
23.16 |
Amino acid frequency
Ala |
Cys |
Asp |
Glu |
Phe |
Gly |
His |
Ile |
Lys |
Leu |
|---|---|---|---|---|---|---|---|---|---|
6.635 ± 0.723 | 0.426 ± 0.079 |
6.773 ± 0.325 | 7.884 ± 0.412 |
3.923 ± 0.245 | 5.968 ± 0.353 |
1.286 ± 0.154 | 6.949 ± 0.269 |
9.253 ± 0.38 | 8.698 ± 0.343 |
Met |
Asn |
Gln |
Pro |
Arg |
Ser |
Thr |
Val |
Trp |
Tyr |
|---|---|---|---|---|---|---|---|---|---|
2.489 ± 0.195 | 5.922 ± 0.287 |
2.887 ± 0.195 | 3.97 ± 0.227 |
4.312 ± 0.255 | 5.904 ± 0.296 |
5.774 ± 0.284 | 6.079 ± 0.294 |
1.129 ± 0.08 | 3.738 ± 0.37 |
Most of the basic statistics you can see at this page can be downloaded from this CSV file
Proteome-pI is available under Creative Commons Attribution-NoDerivs license, for more details see here
| Reference: Kozlowski LP. Proteome-pI 2.0: Proteome Isoelectric Point Database Update. Nucleic Acids Res. 2021, doi: 10.1093/nar/gkab944 | Contact: Lukasz P. Kozlowski |
