Common chimpanzee papillomavirus 1
Taxonomy: Viruses; Monodnaviria; Shotokuvirae; Cossaviricota; Papovaviricetes; Zurhausenvirales; Papillomaviridae; Firstpapillomavirinae; Alphapapillomavirus; Alphapapillomavirus 10
Average proteome isoelectric point is 6.62
Get precalculated fractions of proteins

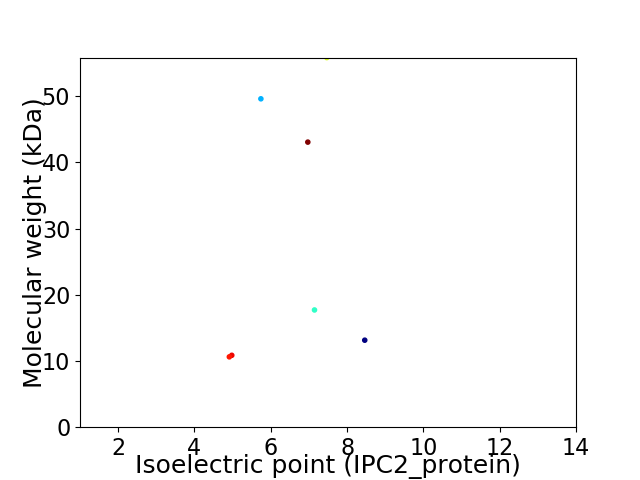
Virtual 2D-PAGE plot for 7 proteins (isoelectric point calculated using IPC2_protein)
Get csv file with sequences according to given criteria:
* You can choose from 21 different methods for calculating isoelectric point
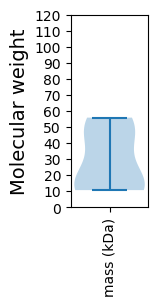
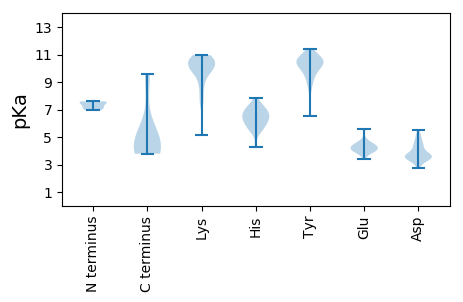
Summary statistics related to proteome-wise predictions


Protein with the lowest isoelectric point:
>tr|O37390|O37390_9PAPI Minor capsid protein L2 OS=Common chimpanzee papillomavirus 1 OX=66261 GN=L2 PE=3 SV=1
MM1 pKa = 7.59EE2 pKa = 4.85LQVVPVDD9 pKa = 3.63VTTTTTNASLLPLLIALTVCLISIILLVFVSEE41 pKa = 4.12FVIYY45 pKa = 10.64SSVLVLTLLIYY56 pKa = 10.95LLLWLLLTTHH66 pKa = 6.57LQFYY70 pKa = 10.77LLTLSLCFIPAFSVHH85 pKa = 6.23QYY87 pKa = 10.58ILQTQQLL94 pKa = 3.8
MM1 pKa = 7.59EE2 pKa = 4.85LQVVPVDD9 pKa = 3.63VTTTTTNASLLPLLIALTVCLISIILLVFVSEE41 pKa = 4.12FVIYY45 pKa = 10.64SSVLVLTLLIYY56 pKa = 10.95LLLWLLLTTHH66 pKa = 6.57LQFYY70 pKa = 10.77LLTLSLCFIPAFSVHH85 pKa = 6.23QYY87 pKa = 10.58ILQTQQLL94 pKa = 3.8
Molecular weight: 10.62 kDa
Isoelectric point according different methods:
Protein with the highest isoelectric point:
>tr|O37389|O37389_9PAPI E5 OS=Common chimpanzee papillomavirus 1 OX=66261 GN=E5 PE=4 SV=1
MM1 pKa = 7.4VKK3 pKa = 9.91HH4 pKa = 6.53CNGKK8 pKa = 9.69YY9 pKa = 10.26VLTAQLYY16 pKa = 9.25VLLHH20 pKa = 6.71LYY22 pKa = 10.35LVLCKK27 pKa = 9.96KK28 pKa = 10.8YY29 pKa = 10.58PMLGLLHH36 pKa = 6.67TPPPLHH42 pKa = 7.09RR43 pKa = 11.84PPTQCRR49 pKa = 11.84PVFQKK54 pKa = 10.59NVCKK58 pKa = 10.35RR59 pKa = 11.84RR60 pKa = 11.84LLNDD64 pKa = 3.22NEE66 pKa = 4.52DD67 pKa = 3.5LHH69 pKa = 7.74NLQEE73 pKa = 4.54KK74 pKa = 10.0PNTPATLCVTQTVQPLTVQTTTSTITVTAVTTDD107 pKa = 3.21GTTVTVLVHH116 pKa = 6.3LL117 pKa = 4.7
MM1 pKa = 7.4VKK3 pKa = 9.91HH4 pKa = 6.53CNGKK8 pKa = 9.69YY9 pKa = 10.26VLTAQLYY16 pKa = 9.25VLLHH20 pKa = 6.71LYY22 pKa = 10.35LVLCKK27 pKa = 9.96KK28 pKa = 10.8YY29 pKa = 10.58PMLGLLHH36 pKa = 6.67TPPPLHH42 pKa = 7.09RR43 pKa = 11.84PPTQCRR49 pKa = 11.84PVFQKK54 pKa = 10.59NVCKK58 pKa = 10.35RR59 pKa = 11.84RR60 pKa = 11.84LLNDD64 pKa = 3.22NEE66 pKa = 4.52DD67 pKa = 3.5LHH69 pKa = 7.74NLQEE73 pKa = 4.54KK74 pKa = 10.0PNTPATLCVTQTVQPLTVQTTTSTITVTAVTTDD107 pKa = 3.21GTTVTVLVHH116 pKa = 6.3LL117 pKa = 4.7
Molecular weight: 13.14 kDa
Isoelectric point according different methods:
Peptides (in silico digests for buttom-up proteomics)
Below you can find in silico digests of the whole proteome with Trypsin, Chymotrypsin, Trypsin+LysC, LysN, ArgC proteases suitable for different mass spec machines.| Try ESI |
 |
|---|
| ChTry ESI |
 |
|---|
| ArgC ESI |
 |
|---|
| LysN ESI |
 |
|---|
| TryLysC ESI |
 |
|---|
| Try MALDI |
 |
|---|
| ChTry MALDI |
 |
|---|
| ArgC MALDI |
 |
|---|
| LysN MALDI |
 |
|---|
| TryLysC MALDI |
 |
|---|
| Try LTQ |
 |
|---|
| ChTry LTQ |
 |
|---|
| ArgC LTQ |
 |
|---|
| LysN LTQ |
 |
|---|
| TryLysC LTQ |
 |
|---|
| Try MSlow |
 |
|---|
| ChTry MSlow |
 |
|---|
| ArgC MSlow |
 |
|---|
| LysN MSlow |
 |
|---|
| TryLysC MSlow |
 |
|---|
| Try MShigh |
 |
|---|
| ChTry MShigh |
 |
|---|
| ArgC MShigh |
 |
|---|
| LysN MShigh |
 |
|---|
| TryLysC MShigh |
 |
|---|
General Statistics
Number of major isoforms |
Number of additional isoforms |
Number of all proteins |
Number of amino acids |
Min. Seq. Length |
Max. Seq. Length |
Avg. Seq. Length |
Avg. Mol. Weight |
|---|---|---|---|---|---|---|---|
0 |
1801 |
94 |
501 |
257.3 |
28.69 |
Amino acid frequency
Ala |
Cys |
Asp |
Glu |
Phe |
Gly |
His |
Ile |
Lys |
Leu |
|---|---|---|---|---|---|---|---|---|---|
5.83 ± 0.537 | 3.109 ± 0.902 |
4.22 ± 0.626 | 4.553 ± 0.619 |
4.164 ± 0.603 | 5.053 ± 0.802 |
2.943 ± 0.437 | 5.108 ± 1.063 |
4.997 ± 1.058 | 9.162 ± 1.648 |
Met |
Asn |
Gln |
Pro |
Arg |
Ser |
Thr |
Val |
Trp |
Tyr |
|---|---|---|---|---|---|---|---|---|---|
1.721 ± 0.395 | 4.386 ± 0.59 |
6.552 ± 1.113 | 4.997 ± 0.734 |
3.776 ± 0.591 | 8.051 ± 1.208 |
8.773 ± 0.701 | 7.662 ± 0.493 |
1.166 ± 0.313 | 3.776 ± 0.623 |
Most of the basic statistics you can see at this page can be downloaded from this CSV file
Proteome-pI is available under Creative Commons Attribution-NoDerivs license, for more details see here
| Reference: Kozlowski LP. Proteome-pI 2.0: Proteome Isoelectric Point Database Update. Nucleic Acids Res. 2021, doi: 10.1093/nar/gkab944 | Contact: Lukasz P. Kozlowski |
