Roseburia sp. AM16-25
Taxonomy: cellular organisms; Bacteria; Terrabacteria group; Firmicutes; Clostridia; Eubacteriales; Lachnospiraceae; Roseburia; unclassified Roseburia
Average proteome isoelectric point is 5.87
Get precalculated fractions of proteins

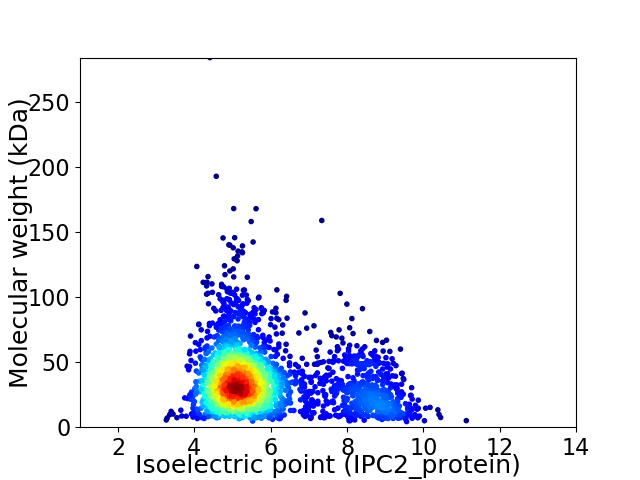
Virtual 2D-PAGE plot for 2357 proteins (isoelectric point calculated using IPC2_protein)
Get csv file with sequences according to given criteria:
* You can choose from 21 different methods for calculating isoelectric point
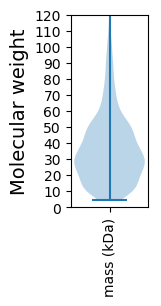
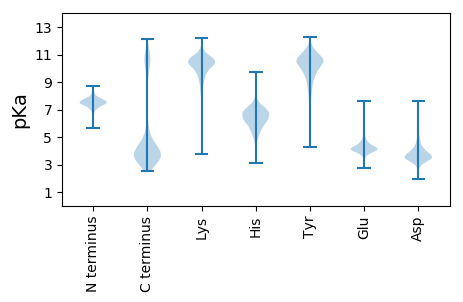
Summary statistics related to proteome-wise predictions


Protein with the lowest isoelectric point:
>tr|A0A3R6HWF4|A0A3R6HWF4_9FIRM Uncharacterized protein OS=Roseburia sp. AM16-25 OX=2292065 GN=DW183_11580 PE=4 SV=1
MM1 pKa = 7.43EE2 pKa = 4.75VFLTMLNIKK11 pKa = 10.17RR12 pKa = 11.84FACTGLAAILVVSLPACGKK31 pKa = 9.93DD32 pKa = 3.04KK33 pKa = 11.35SSGYY37 pKa = 8.78TPLPEE42 pKa = 5.15EE43 pKa = 5.55DD44 pKa = 3.38DD45 pKa = 3.72TVYY48 pKa = 11.03NISLCQDD55 pKa = 3.3EE56 pKa = 5.87DD57 pKa = 3.48SDD59 pKa = 4.62YY60 pKa = 11.55YY61 pKa = 11.98NNISQGFNDD70 pKa = 4.41ALTDD74 pKa = 4.01LFGSAHH80 pKa = 5.64VNVTTMVANDD90 pKa = 4.17TIGTDD95 pKa = 4.23SICADD100 pKa = 3.96YY101 pKa = 10.15VTGGTDD107 pKa = 4.82LIFANGKK114 pKa = 9.9KK115 pKa = 9.91SLSSAATATEE125 pKa = 4.97DD126 pKa = 3.5IPIVGAAVMDD136 pKa = 4.15YY137 pKa = 11.15QSVLHH142 pKa = 6.75LATASDD148 pKa = 3.87SSWNKK153 pKa = 8.66KK154 pKa = 8.22TGTNVTGISSKK165 pKa = 10.93PNLEE169 pKa = 4.14EE170 pKa = 3.82QLSLLIEE177 pKa = 4.37ATPDD181 pKa = 3.46LQSVGLLYY189 pKa = 10.93NPEE192 pKa = 4.25DD193 pKa = 3.56TDD195 pKa = 4.94GIYY198 pKa = 10.76QNVLLEE204 pKa = 4.62KK205 pKa = 10.66YY206 pKa = 9.81LDD208 pKa = 3.58QAGIPWKK215 pKa = 10.34EE216 pKa = 3.76YY217 pKa = 10.94ALPSDD222 pKa = 5.66DD223 pKa = 4.19IDD225 pKa = 4.68SSISDD230 pKa = 4.0EE231 pKa = 4.37LTDD234 pKa = 3.64ATAIAPTKK242 pKa = 10.34QIASSVTEE250 pKa = 3.84GSNNDD255 pKa = 3.3VVSFAGNDD263 pKa = 3.55LLSGIFSPSSAHH275 pKa = 5.8VASTSATWTPDD286 pKa = 3.11LSIANAEE293 pKa = 4.19PLAADD298 pKa = 4.3ASLEE302 pKa = 4.66DD303 pKa = 3.54IVQYY307 pKa = 11.22ACNEE311 pKa = 4.02CSVLFLPAEE320 pKa = 4.23SQLTSEE326 pKa = 4.46VQTIVDD332 pKa = 3.45IATASGTRR340 pKa = 11.84TVGGDD345 pKa = 3.04ASLGQEE351 pKa = 4.57TLVSMYY357 pKa = 10.39KK358 pKa = 10.39DD359 pKa = 4.19PYY361 pKa = 10.29AMGYY365 pKa = 10.04AAGKK369 pKa = 7.19MVYY372 pKa = 10.03RR373 pKa = 11.84ILVDD377 pKa = 3.56GADD380 pKa = 3.91PGDD383 pKa = 3.52IKK385 pKa = 10.34ITNSPAEE392 pKa = 4.0NVKK395 pKa = 10.53LYY397 pKa = 10.04NASRR401 pKa = 11.84AEE403 pKa = 4.08SLGMTFPKK411 pKa = 10.28SFHH414 pKa = 6.9EE415 pKa = 4.4INDD418 pKa = 3.17YY419 pKa = 9.45FANYY423 pKa = 9.49EE424 pKa = 4.02IGSTTTRR431 pKa = 11.84ISSDD435 pKa = 3.3DD436 pKa = 3.44TAEE439 pKa = 3.8
MM1 pKa = 7.43EE2 pKa = 4.75VFLTMLNIKK11 pKa = 10.17RR12 pKa = 11.84FACTGLAAILVVSLPACGKK31 pKa = 9.93DD32 pKa = 3.04KK33 pKa = 11.35SSGYY37 pKa = 8.78TPLPEE42 pKa = 5.15EE43 pKa = 5.55DD44 pKa = 3.38DD45 pKa = 3.72TVYY48 pKa = 11.03NISLCQDD55 pKa = 3.3EE56 pKa = 5.87DD57 pKa = 3.48SDD59 pKa = 4.62YY60 pKa = 11.55YY61 pKa = 11.98NNISQGFNDD70 pKa = 4.41ALTDD74 pKa = 4.01LFGSAHH80 pKa = 5.64VNVTTMVANDD90 pKa = 4.17TIGTDD95 pKa = 4.23SICADD100 pKa = 3.96YY101 pKa = 10.15VTGGTDD107 pKa = 4.82LIFANGKK114 pKa = 9.9KK115 pKa = 9.91SLSSAATATEE125 pKa = 4.97DD126 pKa = 3.5IPIVGAAVMDD136 pKa = 4.15YY137 pKa = 11.15QSVLHH142 pKa = 6.75LATASDD148 pKa = 3.87SSWNKK153 pKa = 8.66KK154 pKa = 8.22TGTNVTGISSKK165 pKa = 10.93PNLEE169 pKa = 4.14EE170 pKa = 3.82QLSLLIEE177 pKa = 4.37ATPDD181 pKa = 3.46LQSVGLLYY189 pKa = 10.93NPEE192 pKa = 4.25DD193 pKa = 3.56TDD195 pKa = 4.94GIYY198 pKa = 10.76QNVLLEE204 pKa = 4.62KK205 pKa = 10.66YY206 pKa = 9.81LDD208 pKa = 3.58QAGIPWKK215 pKa = 10.34EE216 pKa = 3.76YY217 pKa = 10.94ALPSDD222 pKa = 5.66DD223 pKa = 4.19IDD225 pKa = 4.68SSISDD230 pKa = 4.0EE231 pKa = 4.37LTDD234 pKa = 3.64ATAIAPTKK242 pKa = 10.34QIASSVTEE250 pKa = 3.84GSNNDD255 pKa = 3.3VVSFAGNDD263 pKa = 3.55LLSGIFSPSSAHH275 pKa = 5.8VASTSATWTPDD286 pKa = 3.11LSIANAEE293 pKa = 4.19PLAADD298 pKa = 4.3ASLEE302 pKa = 4.66DD303 pKa = 3.54IVQYY307 pKa = 11.22ACNEE311 pKa = 4.02CSVLFLPAEE320 pKa = 4.23SQLTSEE326 pKa = 4.46VQTIVDD332 pKa = 3.45IATASGTRR340 pKa = 11.84TVGGDD345 pKa = 3.04ASLGQEE351 pKa = 4.57TLVSMYY357 pKa = 10.39KK358 pKa = 10.39DD359 pKa = 4.19PYY361 pKa = 10.29AMGYY365 pKa = 10.04AAGKK369 pKa = 7.19MVYY372 pKa = 10.03RR373 pKa = 11.84ILVDD377 pKa = 3.56GADD380 pKa = 3.91PGDD383 pKa = 3.52IKK385 pKa = 10.34ITNSPAEE392 pKa = 4.0NVKK395 pKa = 10.53LYY397 pKa = 10.04NASRR401 pKa = 11.84AEE403 pKa = 4.08SLGMTFPKK411 pKa = 10.28SFHH414 pKa = 6.9EE415 pKa = 4.4INDD418 pKa = 3.17YY419 pKa = 9.45FANYY423 pKa = 9.49EE424 pKa = 4.02IGSTTTRR431 pKa = 11.84ISSDD435 pKa = 3.3DD436 pKa = 3.44TAEE439 pKa = 3.8
Molecular weight: 46.6 kDa
Isoelectric point according different methods:
Protein with the highest isoelectric point:
>tr|A0A3R6MKB2|A0A3R6MKB2_9FIRM tRNA-specific 2-thiouridylase MnmA OS=Roseburia sp. AM16-25 OX=2292065 GN=mnmA PE=3 SV=1
MM1 pKa = 7.67KK2 pKa = 8.72MTFQPKK8 pKa = 8.95KK9 pKa = 7.58RR10 pKa = 11.84QRR12 pKa = 11.84SKK14 pKa = 9.0VHH16 pKa = 5.93GFRR19 pKa = 11.84SRR21 pKa = 11.84MSTAGGRR28 pKa = 11.84KK29 pKa = 8.71VLAARR34 pKa = 11.84RR35 pKa = 11.84AKK37 pKa = 10.1GRR39 pKa = 11.84KK40 pKa = 8.83KK41 pKa = 10.63LSAA44 pKa = 3.95
MM1 pKa = 7.67KK2 pKa = 8.72MTFQPKK8 pKa = 8.95KK9 pKa = 7.58RR10 pKa = 11.84QRR12 pKa = 11.84SKK14 pKa = 9.0VHH16 pKa = 5.93GFRR19 pKa = 11.84SRR21 pKa = 11.84MSTAGGRR28 pKa = 11.84KK29 pKa = 8.71VLAARR34 pKa = 11.84RR35 pKa = 11.84AKK37 pKa = 10.1GRR39 pKa = 11.84KK40 pKa = 8.83KK41 pKa = 10.63LSAA44 pKa = 3.95
Molecular weight: 5.03 kDa
Isoelectric point according different methods:
Peptides (in silico digests for buttom-up proteomics)
Below you can find in silico digests of the whole proteome with Trypsin, Chymotrypsin, Trypsin+LysC, LysN, ArgC proteases suitable for different mass spec machines.| Try ESI |
 |
|---|
| ChTry ESI |
 |
|---|
| ArgC ESI |
 |
|---|
| LysN ESI |
 |
|---|
| TryLysC ESI |
 |
|---|
| Try MALDI |
 |
|---|
| ChTry MALDI |
 |
|---|
| ArgC MALDI |
 |
|---|
| LysN MALDI |
 |
|---|
| TryLysC MALDI |
 |
|---|
| Try LTQ |
 |
|---|
| ChTry LTQ |
 |
|---|
| ArgC LTQ |
 |
|---|
| LysN LTQ |
 |
|---|
| TryLysC LTQ |
 |
|---|
| Try MSlow |
 |
|---|
| ChTry MSlow |
 |
|---|
| ArgC MSlow |
 |
|---|
| LysN MSlow |
 |
|---|
| TryLysC MSlow |
 |
|---|
| Try MShigh |
 |
|---|
| ChTry MShigh |
 |
|---|
| ArgC MShigh |
 |
|---|
| LysN MShigh |
 |
|---|
| TryLysC MShigh |
 |
|---|
General Statistics
Number of major isoforms |
Number of additional isoforms |
Number of all proteins |
Number of amino acids |
Min. Seq. Length |
Max. Seq. Length |
Avg. Seq. Length |
Avg. Mol. Weight |
|---|---|---|---|---|---|---|---|
0 |
795901 |
37 |
2652 |
337.7 |
37.86 |
Amino acid frequency
Ala |
Cys |
Asp |
Glu |
Phe |
Gly |
His |
Ile |
Lys |
Leu |
|---|---|---|---|---|---|---|---|---|---|
7.912 ± 0.048 | 1.478 ± 0.022 |
6.115 ± 0.041 | 7.265 ± 0.049 |
3.986 ± 0.035 | 7.023 ± 0.046 |
1.929 ± 0.022 | 7.181 ± 0.043 |
6.491 ± 0.043 | 8.913 ± 0.052 |
Met |
Asn |
Gln |
Pro |
Arg |
Ser |
Thr |
Val |
Trp |
Tyr |
|---|---|---|---|---|---|---|---|---|---|
3.373 ± 0.027 | 4.046 ± 0.038 |
3.164 ± 0.028 | 3.591 ± 0.03 |
4.276 ± 0.036 | 5.61 ± 0.04 |
5.43 ± 0.045 | 6.986 ± 0.041 |
0.926 ± 0.017 | 4.306 ± 0.042 |
Most of the basic statistics you can see at this page can be downloaded from this CSV file
Proteome-pI is available under Creative Commons Attribution-NoDerivs license, for more details see here
| Reference: Kozlowski LP. Proteome-pI 2.0: Proteome Isoelectric Point Database Update. Nucleic Acids Res. 2021, doi: 10.1093/nar/gkab944 | Contact: Lukasz P. Kozlowski |
