Chaetoceros protobacilladnavirus 1
Taxonomy: Viruses; Monodnaviria; Shotokuvirae; Cressdnaviricota; Arfiviricetes; Baphyvirales; Bacilladnaviridae; Protobacilladnavirus
Average proteome isoelectric point is 7.08
Get precalculated fractions of proteins

Virtual 2D-PAGE plot for 6 proteins (isoelectric point calculated using IPC2_protein)
Get csv file with sequences according to given criteria:
* You can choose from 21 different methods for calculating isoelectric point
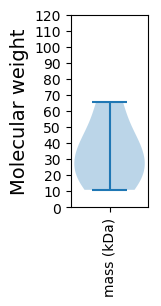
Summary statistics related to proteome-wise predictions


Protein with the lowest isoelectric point:
>tr|Q2L6L9|Q2L6L9_9VIRU Uncharacterized protein OS=Chaetoceros protobacilladnavirus 1 OX=2170140 PE=4 SV=1
MM1 pKa = 7.71RR2 pKa = 11.84NFEE5 pKa = 4.72RR6 pKa = 11.84IMNQVEE12 pKa = 4.33DD13 pKa = 3.81EE14 pKa = 4.57HH15 pKa = 7.58NLPNHH20 pKa = 6.28VYY22 pKa = 10.88ANLMDD27 pKa = 5.77DD28 pKa = 4.21SPACIATMASDD39 pKa = 3.93RR40 pKa = 11.84QWAGAEE46 pKa = 4.06LKK48 pKa = 10.5EE49 pKa = 4.42IAGKK53 pKa = 10.12HH54 pKa = 4.48YY55 pKa = 10.1FYY57 pKa = 11.33AFNTYY62 pKa = 10.65YY63 pKa = 10.83DD64 pKa = 3.61IDD66 pKa = 3.75QLTNRR71 pKa = 11.84AEE73 pKa = 4.32RR74 pKa = 11.84YY75 pKa = 9.39FLEE78 pKa = 4.44QKK80 pKa = 6.94WTLMMYY86 pKa = 10.64NEE88 pKa = 4.2FTMYY92 pKa = 9.94MDD94 pKa = 4.65MLICGYY100 pKa = 10.09KK101 pKa = 10.28FNPHH105 pKa = 4.5YY106 pKa = 8.97TAKK109 pKa = 10.72LFWAPTLQRR118 pKa = 11.84CVDD121 pKa = 3.7APIIDD126 pKa = 3.03IWYY129 pKa = 8.85QFIYY133 pKa = 9.51PDD135 pKa = 3.52EE136 pKa = 4.01VHH138 pKa = 6.18YY139 pKa = 11.31VIDD142 pKa = 3.85LTSDD146 pKa = 3.36DD147 pKa = 4.28GADD150 pKa = 3.35VPFDD154 pKa = 3.69TDD156 pKa = 3.9SIATFDD162 pKa = 3.63VVGPIDD168 pKa = 4.94NDD170 pKa = 3.44ILDD173 pKa = 3.78VWTTPTVPAIIDD185 pKa = 3.72VPNLRR190 pKa = 11.84IDD192 pKa = 3.66LRR194 pKa = 11.84DD195 pKa = 3.12GHH197 pKa = 6.49EE198 pKa = 5.03IIDD201 pKa = 4.01LTNDD205 pKa = 3.6IISS208 pKa = 3.49
MM1 pKa = 7.71RR2 pKa = 11.84NFEE5 pKa = 4.72RR6 pKa = 11.84IMNQVEE12 pKa = 4.33DD13 pKa = 3.81EE14 pKa = 4.57HH15 pKa = 7.58NLPNHH20 pKa = 6.28VYY22 pKa = 10.88ANLMDD27 pKa = 5.77DD28 pKa = 4.21SPACIATMASDD39 pKa = 3.93RR40 pKa = 11.84QWAGAEE46 pKa = 4.06LKK48 pKa = 10.5EE49 pKa = 4.42IAGKK53 pKa = 10.12HH54 pKa = 4.48YY55 pKa = 10.1FYY57 pKa = 11.33AFNTYY62 pKa = 10.65YY63 pKa = 10.83DD64 pKa = 3.61IDD66 pKa = 3.75QLTNRR71 pKa = 11.84AEE73 pKa = 4.32RR74 pKa = 11.84YY75 pKa = 9.39FLEE78 pKa = 4.44QKK80 pKa = 6.94WTLMMYY86 pKa = 10.64NEE88 pKa = 4.2FTMYY92 pKa = 9.94MDD94 pKa = 4.65MLICGYY100 pKa = 10.09KK101 pKa = 10.28FNPHH105 pKa = 4.5YY106 pKa = 8.97TAKK109 pKa = 10.72LFWAPTLQRR118 pKa = 11.84CVDD121 pKa = 3.7APIIDD126 pKa = 3.03IWYY129 pKa = 8.85QFIYY133 pKa = 9.51PDD135 pKa = 3.52EE136 pKa = 4.01VHH138 pKa = 6.18YY139 pKa = 11.31VIDD142 pKa = 3.85LTSDD146 pKa = 3.36DD147 pKa = 4.28GADD150 pKa = 3.35VPFDD154 pKa = 3.69TDD156 pKa = 3.9SIATFDD162 pKa = 3.63VVGPIDD168 pKa = 4.94NDD170 pKa = 3.44ILDD173 pKa = 3.78VWTTPTVPAIIDD185 pKa = 3.72VPNLRR190 pKa = 11.84IDD192 pKa = 3.66LRR194 pKa = 11.84DD195 pKa = 3.12GHH197 pKa = 6.49EE198 pKa = 5.03IIDD201 pKa = 4.01LTNDD205 pKa = 3.6IISS208 pKa = 3.49
Molecular weight: 24.32 kDa
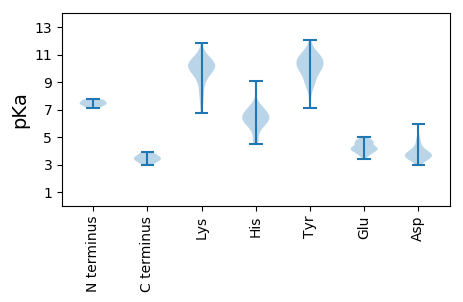
Isoelectric point according different methods:
Protein with the highest isoelectric point:
>tr|Q2L6L7|Q2L6L7_9VIRU Uncharacterized protein OS=Chaetoceros protobacilladnavirus 1 OX=2170140 PE=4 SV=1
MM1 pKa = 7.75RR2 pKa = 11.84AITPKK7 pKa = 10.34SSYY10 pKa = 10.99APAVGVKK17 pKa = 8.62NTMQGAVPLTQEE29 pKa = 4.54EE30 pKa = 4.68PSPMLSSSTVPVVLVRR46 pKa = 11.84PRR48 pKa = 11.84LPTIGTPVRR57 pKa = 11.84VKK59 pKa = 9.89PRR61 pKa = 11.84KK62 pKa = 8.88SAIIVEE68 pKa = 4.54TLTMAISGEE77 pKa = 4.12LADD80 pKa = 5.07RR81 pKa = 11.84PTMGKK86 pKa = 10.17GLSTSRR92 pKa = 11.84NLQAKK97 pKa = 9.83RR98 pKa = 11.84PLADD102 pKa = 3.0
MM1 pKa = 7.75RR2 pKa = 11.84AITPKK7 pKa = 10.34SSYY10 pKa = 10.99APAVGVKK17 pKa = 8.62NTMQGAVPLTQEE29 pKa = 4.54EE30 pKa = 4.68PSPMLSSSTVPVVLVRR46 pKa = 11.84PRR48 pKa = 11.84LPTIGTPVRR57 pKa = 11.84VKK59 pKa = 9.89PRR61 pKa = 11.84KK62 pKa = 8.88SAIIVEE68 pKa = 4.54TLTMAISGEE77 pKa = 4.12LADD80 pKa = 5.07RR81 pKa = 11.84PTMGKK86 pKa = 10.17GLSTSRR92 pKa = 11.84NLQAKK97 pKa = 9.83RR98 pKa = 11.84PLADD102 pKa = 3.0
Molecular weight: 10.82 kDa
Isoelectric point according different methods:
Peptides (in silico digests for buttom-up proteomics)
Below you can find in silico digests of the whole proteome with Trypsin, Chymotrypsin, Trypsin+LysC, LysN, ArgC proteases suitable for different mass spec machines.| Try ESI |
 |
|---|
| ChTry ESI |
 |
|---|
| ArgC ESI |
 |
|---|
| LysN ESI |
 |
|---|
| TryLysC ESI |
 |
|---|
| Try MALDI |
 |
|---|
| ChTry MALDI |
 |
|---|
| ArgC MALDI |
 |
|---|
| LysN MALDI |
 |
|---|
| TryLysC MALDI |
 |
|---|
| Try LTQ |
 |
|---|
| ChTry LTQ |
 |
|---|
| ArgC LTQ |
 |
|---|
| LysN LTQ |
 |
|---|
| TryLysC LTQ |
 |
|---|
| Try MSlow |
 |
|---|
| ChTry MSlow |
 |
|---|
| ArgC MSlow |
 |
|---|
| LysN MSlow |
 |
|---|
| TryLysC MSlow |
 |
|---|
| Try MShigh |
 |
|---|
| ChTry MShigh |
 |
|---|
| ArgC MShigh |
 |
|---|
| LysN MShigh |
 |
|---|
| TryLysC MShigh |
 |
|---|
General Statistics
Number of major isoforms |
Number of additional isoforms |
Number of all proteins |
Number of amino acids |
Min. Seq. Length |
Max. Seq. Length |
Avg. Seq. Length |
Avg. Mol. Weight |
|---|---|---|---|---|---|---|---|
0 |
1799 |
102 |
573 |
299.8 |
33.7 |
Amino acid frequency
Ala |
Cys |
Asp |
Glu |
Phe |
Gly |
His |
Ile |
Lys |
Leu |
|---|---|---|---|---|---|---|---|---|---|
7.115 ± 0.837 | 1.334 ± 0.489 |
6.448 ± 1.024 | 5.392 ± 0.57 |
4.169 ± 0.551 | 7.449 ± 0.797 |
2.446 ± 0.656 | 5.725 ± 0.658 |
5.67 ± 0.902 | 7.059 ± 0.588 |
Met |
Asn |
Gln |
Pro |
Arg |
Ser |
Thr |
Val |
Trp |
Tyr |
|---|---|---|---|---|---|---|---|---|---|
2.223 ± 0.677 | 4.558 ± 0.649 |
5.892 ± 0.753 | 3.835 ± 0.432 |
6.392 ± 0.439 | 6.559 ± 0.804 |
6.893 ± 0.783 | 5.503 ± 0.95 |
2.001 ± 0.502 | 3.335 ± 0.709 |
Most of the basic statistics you can see at this page can be downloaded from this CSV file
Proteome-pI is available under Creative Commons Attribution-NoDerivs license, for more details see here
| Reference: Kozlowski LP. Proteome-pI 2.0: Proteome Isoelectric Point Database Update. Nucleic Acids Res. 2021, doi: 10.1093/nar/gkab944 | Contact: Lukasz P. Kozlowski |
