Thermosphaera aggregans (strain DSM 11486 / M11TL)
Taxonomy: cellular organisms; Archaea; TACK group; Crenarchaeota; Thermoprotei; Desulfurococcales; Desulfurococcaceae; Thermosphaera; Thermosphaera aggregans
Average proteome isoelectric point is 7.01
Get precalculated fractions of proteins

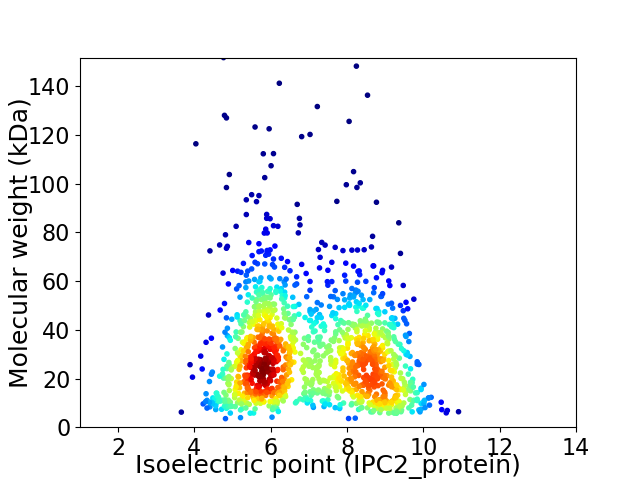
Virtual 2D-PAGE plot for 1387 proteins (isoelectric point calculated using IPC2_protein)
Get csv file with sequences according to given criteria:
* You can choose from 21 different methods for calculating isoelectric point
Summary statistics related to proteome-wise predictions


Protein with the lowest isoelectric point:
>tr|D5U256|D5U256_THEAM 50S ribosomal protein L18Ae OS=Thermosphaera aggregans (strain DSM 11486 / M11TL) OX=633148 GN=rpl18a PE=3 SV=1
MM1 pKa = 7.25NKK3 pKa = 10.3SMIYY7 pKa = 8.02MLSMALVGLSVLAGLAMWTDD27 pKa = 3.52SLKK30 pKa = 10.98ANSYY34 pKa = 10.43VSTGEE39 pKa = 3.96LDD41 pKa = 3.27WEE43 pKa = 4.58IVSGPTIWLDD53 pKa = 3.42ACGLEE58 pKa = 4.24PGYY61 pKa = 11.78GMFKK65 pKa = 10.83GNDD68 pKa = 3.11WNATFLPMPGAAQLDD83 pKa = 4.06KK84 pKa = 11.39DD85 pKa = 4.17VGCTNVSLIDD95 pKa = 3.6SDD97 pKa = 4.86GDD99 pKa = 3.51GDD101 pKa = 4.6YY102 pKa = 10.71DD103 pKa = 3.92TMNVTLVNVYY113 pKa = 8.83PWYY116 pKa = 8.19YY117 pKa = 8.25THH119 pKa = 7.88IAFKK123 pKa = 10.28VHH125 pKa = 6.78NDD127 pKa = 2.9GTIPLKK133 pKa = 9.76IWRR136 pKa = 11.84VVFDD140 pKa = 2.92GHH142 pKa = 6.37EE143 pKa = 3.94YY144 pKa = 10.93YY145 pKa = 10.53EE146 pKa = 4.22INEE149 pKa = 4.48AEE151 pKa = 4.18LQQGVEE157 pKa = 3.78VDD159 pKa = 4.2LNGDD163 pKa = 3.82GQPDD167 pKa = 3.43ILVWWGDD174 pKa = 3.49NFGKK178 pKa = 9.91QLHH181 pKa = 6.67PCQSADD187 pKa = 2.82ISFDD191 pKa = 3.43LTILQTAPQGASLSFTIYY209 pKa = 10.39FDD211 pKa = 4.86AIAWNEE217 pKa = 4.21YY218 pKa = 7.19YY219 pKa = 10.15TPSTVTPIPDD229 pKa = 3.27KK230 pKa = 10.86EE231 pKa = 4.04
MM1 pKa = 7.25NKK3 pKa = 10.3SMIYY7 pKa = 8.02MLSMALVGLSVLAGLAMWTDD27 pKa = 3.52SLKK30 pKa = 10.98ANSYY34 pKa = 10.43VSTGEE39 pKa = 3.96LDD41 pKa = 3.27WEE43 pKa = 4.58IVSGPTIWLDD53 pKa = 3.42ACGLEE58 pKa = 4.24PGYY61 pKa = 11.78GMFKK65 pKa = 10.83GNDD68 pKa = 3.11WNATFLPMPGAAQLDD83 pKa = 4.06KK84 pKa = 11.39DD85 pKa = 4.17VGCTNVSLIDD95 pKa = 3.6SDD97 pKa = 4.86GDD99 pKa = 3.51GDD101 pKa = 4.6YY102 pKa = 10.71DD103 pKa = 3.92TMNVTLVNVYY113 pKa = 8.83PWYY116 pKa = 8.19YY117 pKa = 8.25THH119 pKa = 7.88IAFKK123 pKa = 10.28VHH125 pKa = 6.78NDD127 pKa = 2.9GTIPLKK133 pKa = 9.76IWRR136 pKa = 11.84VVFDD140 pKa = 2.92GHH142 pKa = 6.37EE143 pKa = 3.94YY144 pKa = 10.93YY145 pKa = 10.53EE146 pKa = 4.22INEE149 pKa = 4.48AEE151 pKa = 4.18LQQGVEE157 pKa = 3.78VDD159 pKa = 4.2LNGDD163 pKa = 3.82GQPDD167 pKa = 3.43ILVWWGDD174 pKa = 3.49NFGKK178 pKa = 9.91QLHH181 pKa = 6.67PCQSADD187 pKa = 2.82ISFDD191 pKa = 3.43LTILQTAPQGASLSFTIYY209 pKa = 10.39FDD211 pKa = 4.86AIAWNEE217 pKa = 4.21YY218 pKa = 7.19YY219 pKa = 10.15TPSTVTPIPDD229 pKa = 3.27KK230 pKa = 10.86EE231 pKa = 4.04
Molecular weight: 25.68 kDa
Isoelectric point according different methods:
Protein with the highest isoelectric point:
>tr|D5U255|D5U255_THEAM Translation initiation factor 6 OS=Thermosphaera aggregans (strain DSM 11486 / M11TL) OX=633148 GN=eif6 PE=3 SV=1
MM1 pKa = 7.7ARR3 pKa = 11.84FKK5 pKa = 10.95HH6 pKa = 5.74LARR9 pKa = 11.84KK10 pKa = 9.13LRR12 pKa = 11.84LAAAEE17 pKa = 4.28KK18 pKa = 9.24TNKK21 pKa = 9.57PIPIWVSVKK30 pKa = 8.61TRR32 pKa = 11.84MRR34 pKa = 11.84VRR36 pKa = 11.84RR37 pKa = 11.84GFRR40 pKa = 11.84LRR42 pKa = 11.84NWRR45 pKa = 11.84RR46 pKa = 11.84SKK48 pKa = 10.85LKK50 pKa = 10.81NII52 pKa = 4.23
MM1 pKa = 7.7ARR3 pKa = 11.84FKK5 pKa = 10.95HH6 pKa = 5.74LARR9 pKa = 11.84KK10 pKa = 9.13LRR12 pKa = 11.84LAAAEE17 pKa = 4.28KK18 pKa = 9.24TNKK21 pKa = 9.57PIPIWVSVKK30 pKa = 8.61TRR32 pKa = 11.84MRR34 pKa = 11.84VRR36 pKa = 11.84RR37 pKa = 11.84GFRR40 pKa = 11.84LRR42 pKa = 11.84NWRR45 pKa = 11.84RR46 pKa = 11.84SKK48 pKa = 10.85LKK50 pKa = 10.81NII52 pKa = 4.23
Molecular weight: 6.36 kDa
Isoelectric point according different methods:
Peptides (in silico digests for buttom-up proteomics)
Below you can find in silico digests of the whole proteome with Trypsin, Chymotrypsin, Trypsin+LysC, LysN, ArgC proteases suitable for different mass spec machines.| Try ESI |
 |
|---|
| ChTry ESI |
 |
|---|
| ArgC ESI |
 |
|---|
| LysN ESI |
 |
|---|
| TryLysC ESI |
 |
|---|
| Try MALDI |
 |
|---|
| ChTry MALDI |
 |
|---|
| ArgC MALDI |
 |
|---|
| LysN MALDI |
 |
|---|
| TryLysC MALDI |
 |
|---|
| Try LTQ |
 |
|---|
| ChTry LTQ |
 |
|---|
| ArgC LTQ |
 |
|---|
| LysN LTQ |
 |
|---|
| TryLysC LTQ |
 |
|---|
| Try MSlow |
 |
|---|
| ChTry MSlow |
 |
|---|
| ArgC MSlow |
 |
|---|
| LysN MSlow |
 |
|---|
| TryLysC MSlow |
 |
|---|
| Try MShigh |
 |
|---|
| ChTry MShigh |
 |
|---|
| ArgC MShigh |
 |
|---|
| LysN MShigh |
 |
|---|
| TryLysC MShigh |
 |
|---|
General Statistics
Number of major isoforms |
Number of additional isoforms |
Number of all proteins |
Number of amino acids |
Min. Seq. Length |
Max. Seq. Length |
Avg. Seq. Length |
Avg. Mol. Weight |
|---|---|---|---|---|---|---|---|
0 |
397285 |
32 |
1385 |
286.4 |
32.07 |
Amino acid frequency
Ala |
Cys |
Asp |
Glu |
Phe |
Gly |
His |
Ile |
Lys |
Leu |
|---|---|---|---|---|---|---|---|---|---|
6.797 ± 0.055 | 0.751 ± 0.022 |
4.305 ± 0.039 | 7.37 ± 0.076 |
3.898 ± 0.038 | 7.246 ± 0.055 |
1.637 ± 0.027 | 7.506 ± 0.053 |
6.312 ± 0.07 | 11.012 ± 0.07 |
Met |
Asn |
Gln |
Pro |
Arg |
Ser |
Thr |
Val |
Trp |
Tyr |
|---|---|---|---|---|---|---|---|---|---|
2.175 ± 0.027 | 3.356 ± 0.032 |
4.574 ± 0.041 | 1.875 ± 0.026 |
5.672 ± 0.054 | 6.377 ± 0.056 |
4.912 ± 0.059 | 8.896 ± 0.055 |
1.12 ± 0.026 | 4.209 ± 0.042 |
Most of the basic statistics you can see at this page can be downloaded from this CSV file
Proteome-pI is available under Creative Commons Attribution-NoDerivs license, for more details see here
| Reference: Kozlowski LP. Proteome-pI 2.0: Proteome Isoelectric Point Database Update. Nucleic Acids Res. 2021, doi: 10.1093/nar/gkab944 | Contact: Lukasz P. Kozlowski |
