Rhodobacterales bacterium HTCC2255
Taxonomy: cellular organisms; Bacteria; Proteobacteria; Alphaproteobacteria; Rhodobacterales; unclassified Rhodobacterales
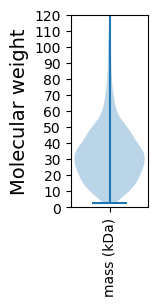
Average proteome isoelectric point is 6.45
Get precalculated fractions of proteins

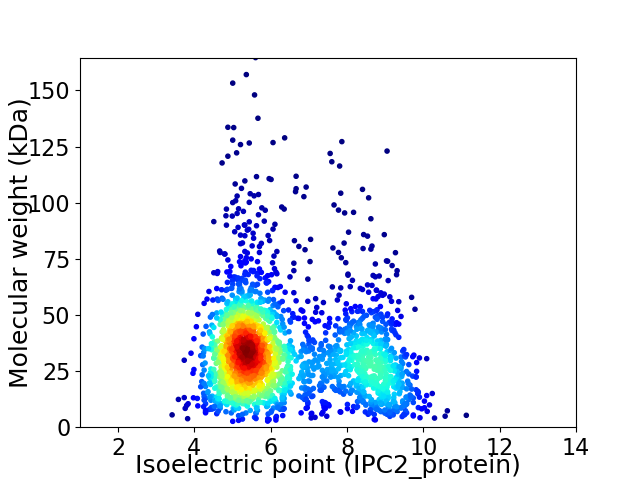
Virtual 2D-PAGE plot for 2236 proteins (isoelectric point calculated using IPC2_protein)
Get csv file with sequences according to given criteria:
* You can choose from 21 different methods for calculating isoelectric point
Summary statistics related to proteome-wise predictions


Protein with the lowest isoelectric point:
>tr|Q0FDT7|Q0FDT7_9RHOB 3-isopropylmalate dehydratase small subunit OS=Rhodobacterales bacterium HTCC2255 OX=367336 GN=leuD PE=3 SV=1
MM1 pKa = 7.63KK2 pKa = 10.41KK3 pKa = 10.44LLLASTALVATAGMAAADD21 pKa = 3.75VTITGHH27 pKa = 6.36AAAGYY32 pKa = 10.44HH33 pKa = 6.6SDD35 pKa = 4.09LDD37 pKa = 4.11GKK39 pKa = 10.91GVATAATTDD48 pKa = 3.07SGIYY52 pKa = 10.28SNVGVDD58 pKa = 4.05FAMSGATDD66 pKa = 3.52GGLTFTASMNIDD78 pKa = 3.54AGTEE82 pKa = 3.56IDD84 pKa = 4.08SGNFEE89 pKa = 4.46YY90 pKa = 11.0DD91 pKa = 3.2HH92 pKa = 7.08NDD94 pKa = 2.95AGTAGLGAVTISGAFGTLTFDD115 pKa = 4.26NAGIDD120 pKa = 3.55NLYY123 pKa = 10.52NADD126 pKa = 4.09HH127 pKa = 6.88NSHH130 pKa = 6.66DD131 pKa = 3.89VKK133 pKa = 10.99FAGTVNGVAIAVTADD148 pKa = 3.57ADD150 pKa = 3.97DD151 pKa = 4.41SVAGTSGTAASADD164 pKa = 3.6MSASASIASGAMTYY178 pKa = 11.37ALAVSNHH185 pKa = 5.81EE186 pKa = 4.28ADD188 pKa = 4.71GMATNMKK195 pKa = 8.23VTYY198 pKa = 9.87VVNDD202 pKa = 3.77MLTVSASNDD211 pKa = 3.42KK212 pKa = 10.84EE213 pKa = 4.29STAGADD219 pKa = 3.16AVTKK223 pKa = 10.35VAATIVANGFTIGLSSDD240 pKa = 3.18NSASGGDD247 pKa = 3.24WDD249 pKa = 4.36VDD251 pKa = 3.58LGYY254 pKa = 8.99TLSGVALAYY263 pKa = 8.86GTDD266 pKa = 4.1EE267 pKa = 4.08NDD269 pKa = 2.49AWAATASKK277 pKa = 10.67SLGGGATAAAGINWEE292 pKa = 4.13DD293 pKa = 3.3SVYY296 pKa = 11.2AGISFAFF303 pKa = 3.99
MM1 pKa = 7.63KK2 pKa = 10.41KK3 pKa = 10.44LLLASTALVATAGMAAADD21 pKa = 3.75VTITGHH27 pKa = 6.36AAAGYY32 pKa = 10.44HH33 pKa = 6.6SDD35 pKa = 4.09LDD37 pKa = 4.11GKK39 pKa = 10.91GVATAATTDD48 pKa = 3.07SGIYY52 pKa = 10.28SNVGVDD58 pKa = 4.05FAMSGATDD66 pKa = 3.52GGLTFTASMNIDD78 pKa = 3.54AGTEE82 pKa = 3.56IDD84 pKa = 4.08SGNFEE89 pKa = 4.46YY90 pKa = 11.0DD91 pKa = 3.2HH92 pKa = 7.08NDD94 pKa = 2.95AGTAGLGAVTISGAFGTLTFDD115 pKa = 4.26NAGIDD120 pKa = 3.55NLYY123 pKa = 10.52NADD126 pKa = 4.09HH127 pKa = 6.88NSHH130 pKa = 6.66DD131 pKa = 3.89VKK133 pKa = 10.99FAGTVNGVAIAVTADD148 pKa = 3.57ADD150 pKa = 3.97DD151 pKa = 4.41SVAGTSGTAASADD164 pKa = 3.6MSASASIASGAMTYY178 pKa = 11.37ALAVSNHH185 pKa = 5.81EE186 pKa = 4.28ADD188 pKa = 4.71GMATNMKK195 pKa = 8.23VTYY198 pKa = 9.87VVNDD202 pKa = 3.77MLTVSASNDD211 pKa = 3.42KK212 pKa = 10.84EE213 pKa = 4.29STAGADD219 pKa = 3.16AVTKK223 pKa = 10.35VAATIVANGFTIGLSSDD240 pKa = 3.18NSASGGDD247 pKa = 3.24WDD249 pKa = 4.36VDD251 pKa = 3.58LGYY254 pKa = 8.99TLSGVALAYY263 pKa = 8.86GTDD266 pKa = 4.1EE267 pKa = 4.08NDD269 pKa = 2.49AWAATASKK277 pKa = 10.67SLGGGATAAAGINWEE292 pKa = 4.13DD293 pKa = 3.3SVYY296 pKa = 11.2AGISFAFF303 pKa = 3.99
Molecular weight: 29.84 kDa
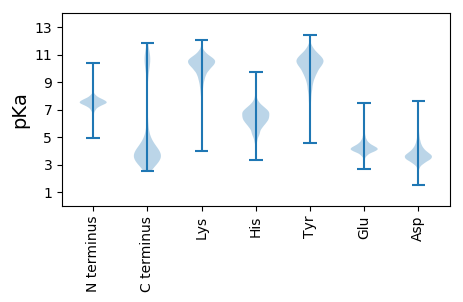
Isoelectric point according different methods:
Protein with the highest isoelectric point:
>tr|Q0FD54|Q0FD54_9RHOB Membrane protein insertase YidC OS=Rhodobacterales bacterium HTCC2255 OX=367336 GN=yidC PE=3 SV=1
MM1 pKa = 7.35KK2 pKa = 9.44RR3 pKa = 11.84TYY5 pKa = 10.31QPSNLVRR12 pKa = 11.84KK13 pKa = 8.96RR14 pKa = 11.84RR15 pKa = 11.84HH16 pKa = 4.62GFRR19 pKa = 11.84SRR21 pKa = 11.84MATKK25 pKa = 10.45NGRR28 pKa = 11.84KK29 pKa = 8.58ILNRR33 pKa = 11.84RR34 pKa = 11.84RR35 pKa = 11.84VQGRR39 pKa = 11.84KK40 pKa = 9.39SLSAA44 pKa = 3.83
MM1 pKa = 7.35KK2 pKa = 9.44RR3 pKa = 11.84TYY5 pKa = 10.31QPSNLVRR12 pKa = 11.84KK13 pKa = 8.96RR14 pKa = 11.84RR15 pKa = 11.84HH16 pKa = 4.62GFRR19 pKa = 11.84SRR21 pKa = 11.84MATKK25 pKa = 10.45NGRR28 pKa = 11.84KK29 pKa = 8.58ILNRR33 pKa = 11.84RR34 pKa = 11.84RR35 pKa = 11.84VQGRR39 pKa = 11.84KK40 pKa = 9.39SLSAA44 pKa = 3.83
Molecular weight: 5.3 kDa
Isoelectric point according different methods:
Peptides (in silico digests for buttom-up proteomics)
Below you can find in silico digests of the whole proteome with Trypsin, Chymotrypsin, Trypsin+LysC, LysN, ArgC proteases suitable for different mass spec machines.| Try ESI |
 |
|---|
| ChTry ESI |
 |
|---|
| ArgC ESI |
 |
|---|
| LysN ESI |
 |
|---|
| TryLysC ESI |
 |
|---|
| Try MALDI |
 |
|---|
| ChTry MALDI |
 |
|---|
| ArgC MALDI |
 |
|---|
| LysN MALDI |
 |
|---|
| TryLysC MALDI |
 |
|---|
| Try LTQ |
 |
|---|
| ChTry LTQ |
 |
|---|
| ArgC LTQ |
 |
|---|
| LysN LTQ |
 |
|---|
| TryLysC LTQ |
 |
|---|
| Try MSlow |
 |
|---|
| ChTry MSlow |
 |
|---|
| ArgC MSlow |
 |
|---|
| LysN MSlow |
 |
|---|
| TryLysC MSlow |
 |
|---|
| Try MShigh |
 |
|---|
| ChTry MShigh |
 |
|---|
| ArgC MShigh |
 |
|---|
| LysN MShigh |
 |
|---|
| TryLysC MShigh |
 |
|---|
General Statistics
Number of major isoforms |
Number of additional isoforms |
Number of all proteins |
Number of amino acids |
Min. Seq. Length |
Max. Seq. Length |
Avg. Seq. Length |
Avg. Mol. Weight |
|---|---|---|---|---|---|---|---|
0 |
704440 |
21 |
1508 |
315.0 |
34.84 |
Amino acid frequency
Ala |
Cys |
Asp |
Glu |
Phe |
Gly |
His |
Ile |
Lys |
Leu |
|---|---|---|---|---|---|---|---|---|---|
8.45 ± 0.057 | 1.034 ± 0.014 |
5.642 ± 0.04 | 5.914 ± 0.052 |
4.338 ± 0.041 | 7.523 ± 0.039 |
1.968 ± 0.027 | 7.893 ± 0.046 |
5.995 ± 0.044 | 9.642 ± 0.057 |
Met |
Asn |
Gln |
Pro |
Arg |
Ser |
Thr |
Val |
Trp |
Tyr |
|---|---|---|---|---|---|---|---|---|---|
2.863 ± 0.027 | 4.879 ± 0.042 |
4.069 ± 0.032 | 3.062 ± 0.02 |
4.561 ± 0.038 | 6.724 ± 0.038 |
5.171 ± 0.028 | 6.317 ± 0.045 |
1.273 ± 0.02 | 2.684 ± 0.024 |
Most of the basic statistics you can see at this page can be downloaded from this CSV file
Proteome-pI is available under Creative Commons Attribution-NoDerivs license, for more details see here
| Reference: Kozlowski LP. Proteome-pI 2.0: Proteome Isoelectric Point Database Update. Nucleic Acids Res. 2021, doi: 10.1093/nar/gkab944 | Contact: Lukasz P. Kozlowski |
