Bordetella hinzii
Taxonomy: cellular organisms; Bacteria; Proteobacteria; Betaproteobacteria;
Average proteome isoelectric point is 7.0
Get precalculated fractions of proteins
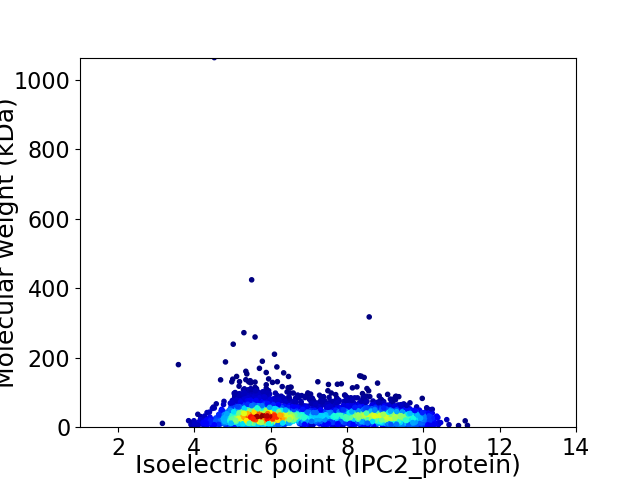
Virtual 2D-PAGE plot for 4557 proteins (isoelectric point calculated using IPC2_protein)
Get csv file with sequences according to given criteria:
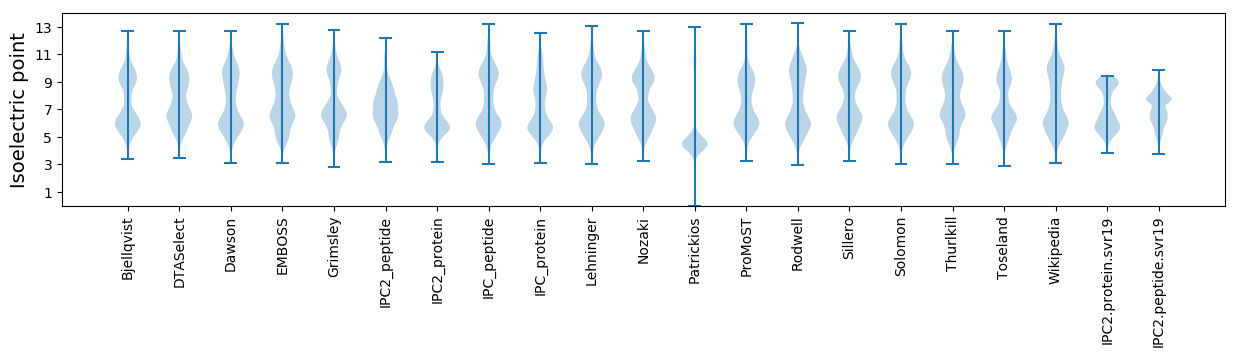
* You can choose from 21 different methods for calculating isoelectric point
Summary statistics related to proteome-wise predictions
Protein with the lowest isoelectric point:
>tr|A0A0H4VVG9|A0A0H4VVG9_9BORD Putative HTH-type transcriptional regulator YdcR OS=Bordetella hinzii OX=103855 GN=ydcR PE=3 SV=1
MM1 pKa = 7.58SSTVNLVEE9 pKa = 4.17LQPGAVLLMTDD20 pKa = 3.98GAVVEE25 pKa = 5.11VIEE28 pKa = 4.65NPQDD32 pKa = 4.33GIWITCRR39 pKa = 11.84YY40 pKa = 8.99LSHH43 pKa = 7.64PGNPALVNGEE53 pKa = 4.11EE54 pKa = 4.12QQVFATDD61 pKa = 3.2IQAYY65 pKa = 10.28AEE67 pKa = 4.22APP69 pKa = 3.46
MM1 pKa = 7.58SSTVNLVEE9 pKa = 4.17LQPGAVLLMTDD20 pKa = 3.98GAVVEE25 pKa = 5.11VIEE28 pKa = 4.65NPQDD32 pKa = 4.33GIWITCRR39 pKa = 11.84YY40 pKa = 8.99LSHH43 pKa = 7.64PGNPALVNGEE53 pKa = 4.11EE54 pKa = 4.12QQVFATDD61 pKa = 3.2IQAYY65 pKa = 10.28AEE67 pKa = 4.22APP69 pKa = 3.46
Molecular weight: 7.41 kDa
Isoelectric point according different methods:
Protein with the highest isoelectric point:
>tr|A0A0H4WLZ6|A0A0H4WLZ6_9BORD ATP-dependent RNA helicase HrpB OS=Bordetella hinzii OX=103855 GN=hrpB PE=4 SV=1
MM1 pKa = 7.35KK2 pKa = 9.36RR3 pKa = 11.84TYY5 pKa = 10.06QPSVTRR11 pKa = 11.84RR12 pKa = 11.84KK13 pKa = 8.0RR14 pKa = 11.84THH16 pKa = 5.76GFRR19 pKa = 11.84VRR21 pKa = 11.84MKK23 pKa = 8.99TRR25 pKa = 11.84AGRR28 pKa = 11.84AVLNARR34 pKa = 11.84RR35 pKa = 11.84AKK37 pKa = 9.65GRR39 pKa = 11.84KK40 pKa = 8.75RR41 pKa = 11.84LAVV44 pKa = 3.41
MM1 pKa = 7.35KK2 pKa = 9.36RR3 pKa = 11.84TYY5 pKa = 10.06QPSVTRR11 pKa = 11.84RR12 pKa = 11.84KK13 pKa = 8.0RR14 pKa = 11.84THH16 pKa = 5.76GFRR19 pKa = 11.84VRR21 pKa = 11.84MKK23 pKa = 8.99TRR25 pKa = 11.84AGRR28 pKa = 11.84AVLNARR34 pKa = 11.84RR35 pKa = 11.84AKK37 pKa = 9.65GRR39 pKa = 11.84KK40 pKa = 8.75RR41 pKa = 11.84LAVV44 pKa = 3.41
Molecular weight: 5.22 kDa
Isoelectric point according different methods:
Peptides (in silico digests for buttom-up proteomics)
Below you can find in silico digests of the whole proteome with Trypsin, Chymotrypsin, Trypsin+LysC, LysN, ArgC proteases suitable for different mass spec machines.| Try ESI |
 |
|---|
| ChTry ESI |
|
|---|
| ArgC ESI |
|
|---|
| LysN ESI |
|
|---|
| TryLysC ESI |
|
|---|
| Try MALDI |
|
|---|
| ChTry MALDI |
|
|---|
| ArgC MALDI |
|
|---|
| LysN MALDI |
|
|---|
| TryLysC MALDI |
|
|---|
| Try LTQ |
|
|---|
| ChTry LTQ |
|
|---|
| ArgC LTQ |
|
|---|
| LysN LTQ |
|
|---|
| TryLysC LTQ |
|
|---|
| Try MSlow |
|
|---|
| ChTry MSlow |
|
|---|
| ArgC MSlow |
|
|---|
| LysN MSlow |
|
|---|
| TryLysC MSlow |
|
|---|
| Try MShigh |
|
|---|
| ChTry MShigh |
|
|---|
| ArgC MShigh |
|
|---|
| LysN MShigh |
|
|---|
| TryLysC MShigh |
|
|---|
General Statistics
Number of major isoforms |
Number of additional isoforms |
Number of all proteins |
Number of amino acids |
Min. Seq. Length |
Max. Seq. Length |
Avg. Seq. Length |
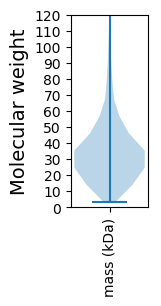
Avg. Mol. Weight |
|---|---|---|---|---|---|---|---|
0 |
1500318 |
29 |
10506 |
329.2 |
35.66 |
Amino acid frequency
Ala |
Cys |
Asp |
Glu |
Phe |
Gly |
His |
Ile |
Lys |
Leu |
|---|---|---|---|---|---|---|---|---|---|
13.374 ± 0.053 | 0.862 ± 0.013 |
5.266 ± 0.027 | 5.063 ± 0.036 |
3.322 ± 0.027 | 8.738 ± 0.057 |
2.106 ± 0.018 | 4.422 ± 0.026 |
2.724 ± 0.036 | 11.169 ± 0.056 |
Met |
Asn |
Gln |
Pro |
Arg |
Ser |
Thr |
Val |
Trp |
Tyr |
|---|---|---|---|---|---|---|---|---|---|
2.449 ± 0.021 | 2.428 ± 0.028 |
5.364 ± 0.033 | 4.035 ± 0.021 |
7.518 ± 0.041 | 5.114 ± 0.035 |
4.717 ± 0.033 | 7.464 ± 0.031 |
1.451 ± 0.018 | 2.417 ± 0.018 |
Most of the basic statistics you can see at this page can be downloaded from this CSV file
See this proteome in:

Proteome-pI is available under Creative Commons Attribution-NoDerivs license, for more details see here
| Reference: Kozlowski LP. Proteome-pI 2.0: Proteome Isoelectric Point Database Update. Nucleic Acids Res. 2021, doi: 10.1093/nar/gkab944 | Contact: Lukasz P. Kozlowski |