Talaromyces islandicus (Penicillium islandicum)
Taxonomy: cellular organisms; Eukaryota; Opisthokonta; Fungi; Dikarya; Ascomycota; saccharomyceta; Pezizomycotina; leotiomyceta;
Average proteome isoelectric point is 6.27
Get precalculated fractions of proteins

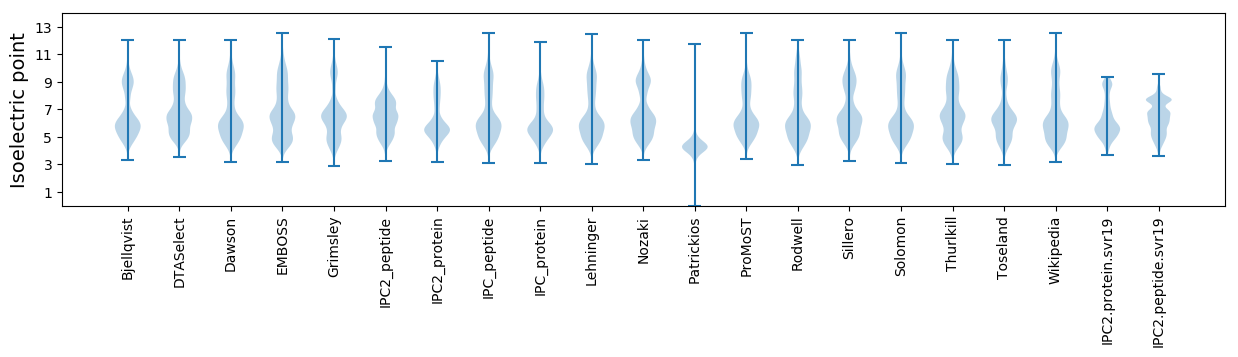
Virtual 2D-PAGE plot for 9927 proteins (isoelectric point calculated using IPC2_protein)
Get csv file with sequences according to given criteria:
* You can choose from 21 different methods for calculating isoelectric point
Summary statistics related to proteome-wise predictions

Protein with the lowest isoelectric point:
>tr|A0A0U1LRM5|A0A0U1LRM5_TALIS Neurofilament heavy polypeptide OS=Talaromyces islandicus OX=28573 GN=PISL3812_03062 PE=4 SV=1
MM1 pKa = 7.8KK2 pKa = 9.68STLTLATVATLAGLLATGVTAEE24 pKa = 4.69DD25 pKa = 3.27QDD27 pKa = 4.08PYY29 pKa = 11.56LFVAFVQSDD38 pKa = 3.62DD39 pKa = 4.36PLNHH43 pKa = 7.57DD44 pKa = 4.06YY45 pKa = 10.54MFSPGIQVNGDD56 pKa = 3.62TLIHH60 pKa = 6.71LGHH63 pKa = 6.96GGLFFYY69 pKa = 11.09VDD71 pKa = 4.47DD72 pKa = 4.19STSQLVMTADD82 pKa = 3.16NHH84 pKa = 7.26DD85 pKa = 4.21IIGNAWIDD93 pKa = 3.65TNDD96 pKa = 3.39RR97 pKa = 11.84GILKK101 pKa = 10.41FSNDD105 pKa = 3.8PDD107 pKa = 3.47AHH109 pKa = 6.9DD110 pKa = 3.68YY111 pKa = 11.86ALFTRR116 pKa = 11.84DD117 pKa = 3.06YY118 pKa = 11.48DD119 pKa = 4.23DD120 pKa = 3.65RR121 pKa = 11.84TNTLLPQGADD131 pKa = 5.16DD132 pKa = 4.02LWFWCPLDD140 pKa = 3.98DD141 pKa = 5.59AEE143 pKa = 5.02VNGTVAVGQVAGDD156 pKa = 3.52GCEE159 pKa = 3.88QLKK162 pKa = 10.34GVQIAYY168 pKa = 10.5GDD170 pKa = 3.48
MM1 pKa = 7.8KK2 pKa = 9.68STLTLATVATLAGLLATGVTAEE24 pKa = 4.69DD25 pKa = 3.27QDD27 pKa = 4.08PYY29 pKa = 11.56LFVAFVQSDD38 pKa = 3.62DD39 pKa = 4.36PLNHH43 pKa = 7.57DD44 pKa = 4.06YY45 pKa = 10.54MFSPGIQVNGDD56 pKa = 3.62TLIHH60 pKa = 6.71LGHH63 pKa = 6.96GGLFFYY69 pKa = 11.09VDD71 pKa = 4.47DD72 pKa = 4.19STSQLVMTADD82 pKa = 3.16NHH84 pKa = 7.26DD85 pKa = 4.21IIGNAWIDD93 pKa = 3.65TNDD96 pKa = 3.39RR97 pKa = 11.84GILKK101 pKa = 10.41FSNDD105 pKa = 3.8PDD107 pKa = 3.47AHH109 pKa = 6.9DD110 pKa = 3.68YY111 pKa = 11.86ALFTRR116 pKa = 11.84DD117 pKa = 3.06YY118 pKa = 11.48DD119 pKa = 4.23DD120 pKa = 3.65RR121 pKa = 11.84TNTLLPQGADD131 pKa = 5.16DD132 pKa = 4.02LWFWCPLDD140 pKa = 3.98DD141 pKa = 5.59AEE143 pKa = 5.02VNGTVAVGQVAGDD156 pKa = 3.52GCEE159 pKa = 3.88QLKK162 pKa = 10.34GVQIAYY168 pKa = 10.5GDD170 pKa = 3.48
Molecular weight: 18.48 kDa
Isoelectric point according different methods:
Protein with the highest isoelectric point:
>tr|A0A0U1LP54|A0A0U1LP54_TALIS Catabolic 3-dehydroquinase OS=Talaromyces islandicus OX=28573 GN=qutE PE=3 SV=1
MM1 pKa = 7.63SLTTPPAVPSPFSRR15 pKa = 11.84TASFPSSPGFRR26 pKa = 11.84SRR28 pKa = 11.84LPIPCKK34 pKa = 10.23SPPSIRR40 pKa = 11.84DD41 pKa = 3.43TTPSVPSAPALGSSSSARR59 pKa = 11.84LDD61 pKa = 3.21EE62 pKa = 4.32RR63 pKa = 11.84RR64 pKa = 11.84AARR67 pKa = 11.84DD68 pKa = 3.19ARR70 pKa = 11.84PRR72 pKa = 11.84PWSDD76 pKa = 2.78RR77 pKa = 11.84PTWAPAKK84 pKa = 8.75PRR86 pKa = 11.84CVRR89 pKa = 11.84PSPAQLATLCPRR101 pKa = 11.84RR102 pKa = 11.84LFDD105 pKa = 3.83RR106 pKa = 11.84QQARR110 pKa = 11.84QRR112 pKa = 11.84RR113 pKa = 11.84DD114 pKa = 3.36RR115 pKa = 11.84PWAVSASPCRR125 pKa = 11.84QSQSSTSPSAATSSAAAAIAPSGLRR150 pKa = 11.84GILKK154 pKa = 9.91SRR156 pKa = 11.84CSVPRR161 pKa = 11.84AAKK164 pKa = 10.24KK165 pKa = 10.11KK166 pKa = 8.94VVWSADD172 pKa = 3.37STVVEE177 pKa = 3.92VSRR180 pKa = 11.84WIKK183 pKa = 10.34EE184 pKa = 3.96SEE186 pKa = 4.32EE187 pKa = 4.06YY188 pKa = 10.95DD189 pKa = 3.72DD190 pKa = 5.9DD191 pKa = 5.13NEE193 pKa = 4.41VYY195 pKa = 10.64EE196 pKa = 4.52AMCFF200 pKa = 3.49
MM1 pKa = 7.63SLTTPPAVPSPFSRR15 pKa = 11.84TASFPSSPGFRR26 pKa = 11.84SRR28 pKa = 11.84LPIPCKK34 pKa = 10.23SPPSIRR40 pKa = 11.84DD41 pKa = 3.43TTPSVPSAPALGSSSSARR59 pKa = 11.84LDD61 pKa = 3.21EE62 pKa = 4.32RR63 pKa = 11.84RR64 pKa = 11.84AARR67 pKa = 11.84DD68 pKa = 3.19ARR70 pKa = 11.84PRR72 pKa = 11.84PWSDD76 pKa = 2.78RR77 pKa = 11.84PTWAPAKK84 pKa = 8.75PRR86 pKa = 11.84CVRR89 pKa = 11.84PSPAQLATLCPRR101 pKa = 11.84RR102 pKa = 11.84LFDD105 pKa = 3.83RR106 pKa = 11.84QQARR110 pKa = 11.84QRR112 pKa = 11.84RR113 pKa = 11.84DD114 pKa = 3.36RR115 pKa = 11.84PWAVSASPCRR125 pKa = 11.84QSQSSTSPSAATSSAAAAIAPSGLRR150 pKa = 11.84GILKK154 pKa = 9.91SRR156 pKa = 11.84CSVPRR161 pKa = 11.84AAKK164 pKa = 10.24KK165 pKa = 10.11KK166 pKa = 8.94VVWSADD172 pKa = 3.37STVVEE177 pKa = 3.92VSRR180 pKa = 11.84WIKK183 pKa = 10.34EE184 pKa = 3.96SEE186 pKa = 4.32EE187 pKa = 4.06YY188 pKa = 10.95DD189 pKa = 3.72DD190 pKa = 5.9DD191 pKa = 5.13NEE193 pKa = 4.41VYY195 pKa = 10.64EE196 pKa = 4.52AMCFF200 pKa = 3.49
Molecular weight: 21.79 kDa
Isoelectric point according different methods:
Peptides (in silico digests for buttom-up proteomics)
Below you can find in silico digests of the whole proteome with Trypsin, Chymotrypsin, Trypsin+LysC, LysN, ArgC proteases suitable for different mass spec machines.| Try ESI |
 |
|---|
| ChTry ESI |
|
|---|
| ArgC ESI |
|
|---|
| LysN ESI |
|
|---|
| TryLysC ESI |
|
|---|
| Try MALDI |
|
|---|
| ChTry MALDI |
|
|---|
| ArgC MALDI |
|
|---|
| LysN MALDI |
|
|---|
| TryLysC MALDI |
|
|---|
| Try LTQ |
|
|---|
| ChTry LTQ |
|
|---|
| ArgC LTQ |
|
|---|
| LysN LTQ |
|
|---|
| TryLysC LTQ |
|
|---|
| Try MSlow |
|
|---|
| ChTry MSlow |
|
|---|
| ArgC MSlow |
|
|---|
| LysN MSlow |
|
|---|
| TryLysC MSlow |
|
|---|
| Try MShigh |
|
|---|
| ChTry MShigh |
|
|---|
| ArgC MShigh |
|
|---|
| LysN MShigh |
|
|---|
| TryLysC MShigh |
|
|---|
General Statistics
Number of major isoforms |
Number of additional isoforms |
Number of all proteins |
Number of amino acids |
Min. Seq. Length |
Max. Seq. Length |
Avg. Seq. Length |
Avg. Mol. Weight |
|---|---|---|---|---|---|---|---|
0 |
5349850 |
66 |
9048 |
538.9 |
59.69 |
Amino acid frequency
Ala |
Cys |
Asp |
Glu |
Phe |
Gly |
His |
Ile |
Lys |
Leu |
|---|---|---|---|---|---|---|---|---|---|
8.39 ± 0.022 | 1.158 ± 0.008 |
5.746 ± 0.016 | 6.077 ± 0.023 |
3.834 ± 0.014 | 6.679 ± 0.021 |
2.393 ± 0.01 | 5.156 ± 0.015 |
4.762 ± 0.019 | 9.017 ± 0.022 |
Met |
Asn |
Gln |
Pro |
Arg |
Ser |
Thr |
Val |
Trp |
Tyr |
|---|---|---|---|---|---|---|---|---|---|
2.094 ± 0.008 | 3.937 ± 0.012 |
5.796 ± 0.025 | 4.095 ± 0.017 |
5.827 ± 0.019 | 8.493 ± 0.025 |
6.017 ± 0.017 | 6.204 ± 0.018 |
1.454 ± 0.008 | 2.868 ± 0.014 |
Most of the basic statistics you can see at this page can be downloaded from this CSV file
See this proteome in:

Proteome-pI is available under Creative Commons Attribution-NoDerivs license, for more details see here
| Reference: Kozlowski LP. Proteome-pI 2.0: Proteome Isoelectric Point Database Update. Nucleic Acids Res. 2021, doi: 10.1093/nar/gkab944 | Contact: Lukasz P. Kozlowski |