Hungatella hathewayi WAL-18680
Taxonomy: cellular organisms; Bacteria; Terrabacteria group; Firmicutes; Clostridia; Eubacteriales; Clostridiaceae; Hungatella; Hungatella hathewayi
Average proteome isoelectric point is 5.92
Get precalculated fractions of proteins

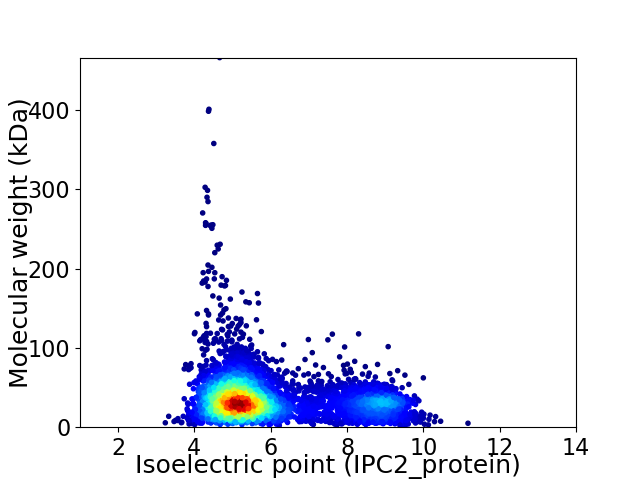
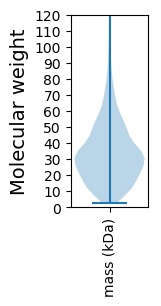
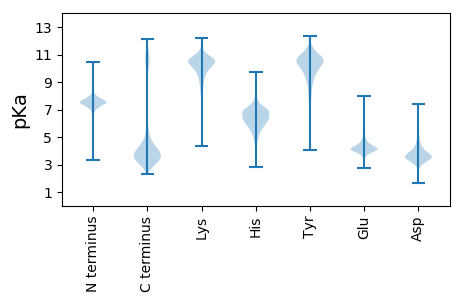
Virtual 2D-PAGE plot for 5166 proteins (isoelectric point calculated using IPC2_protein)
Get csv file with sequences according to given criteria:
* You can choose from 21 different methods for calculating isoelectric point
Summary statistics related to proteome-wise predictions


Protein with the lowest isoelectric point:
>tr|G5IBN5|G5IBN5_9CLOT Pept_C1 domain-containing protein OS=Hungatella hathewayi WAL-18680 OX=742737 GN=HMPREF9473_00912 PE=4 SV=1
MM1 pKa = 7.52EE2 pKa = 4.84MLEE5 pKa = 4.3GADD8 pKa = 3.6VEE10 pKa = 4.36VLEE13 pKa = 5.55DD14 pKa = 4.46IEE16 pKa = 6.08IIDD19 pKa = 4.29EE20 pKa = 4.14NPEE23 pKa = 3.91IFDD26 pKa = 3.56EE27 pKa = 4.95DD28 pKa = 4.23YY29 pKa = 11.3VDD31 pKa = 4.48NVMDD35 pKa = 3.99SVTTEE40 pKa = 3.74TLEE43 pKa = 4.75FEE45 pKa = 4.54EE46 pKa = 4.93EE47 pKa = 3.87LDD49 pKa = 3.9NNVAEE54 pKa = 4.31ASEE57 pKa = 4.29IVEE60 pKa = 4.63MPDD63 pKa = 2.45IDD65 pKa = 4.28YY66 pKa = 10.42NQVYY70 pKa = 10.65AEE72 pKa = 4.51IEE74 pKa = 4.03EE75 pKa = 4.38EE76 pKa = 4.09LNQFDD81 pKa = 6.02FDD83 pKa = 5.22DD84 pKa = 5.39LDD86 pKa = 3.35IFKK89 pKa = 11.0NEE91 pKa = 3.46EE92 pKa = 4.12HH93 pKa = 7.23LNDD96 pKa = 4.5LLDD99 pKa = 4.84GFAQSKK105 pKa = 7.12WEE107 pKa = 4.08RR108 pKa = 11.84MDD110 pKa = 3.33TLEE113 pKa = 4.76RR114 pKa = 11.84KK115 pKa = 9.25EE116 pKa = 4.54VMDD119 pKa = 4.15NLADD123 pKa = 3.87YY124 pKa = 10.41VAEE127 pKa = 4.06AVGIEE132 pKa = 4.07HH133 pKa = 6.6TPDD136 pKa = 2.47ISFYY140 pKa = 10.61YY141 pKa = 10.43NPEE144 pKa = 3.85NGDD147 pKa = 3.36YY148 pKa = 11.45GEE150 pKa = 4.32YY151 pKa = 10.79NEE153 pKa = 5.51LDD155 pKa = 3.31NKK157 pKa = 10.5IKK159 pKa = 10.64INEE162 pKa = 4.1YY163 pKa = 10.83CLDD166 pKa = 4.31DD167 pKa = 4.59SNEE170 pKa = 3.89ALDD173 pKa = 4.24TVVHH177 pKa = 5.84EE178 pKa = 4.99LWHH181 pKa = 5.94SYY183 pKa = 7.4QRR185 pKa = 11.84QRR187 pKa = 11.84ASNPQTAKK195 pKa = 10.75DD196 pKa = 3.51YY197 pKa = 10.37QYY199 pKa = 11.22QYY201 pKa = 11.71NFDD204 pKa = 4.2HH205 pKa = 6.83YY206 pKa = 10.71IEE208 pKa = 4.63PLKK211 pKa = 11.1GPDD214 pKa = 3.34GNYY217 pKa = 10.24VNIINYY223 pKa = 8.94EE224 pKa = 4.0EE225 pKa = 3.95QLVEE229 pKa = 4.0VEE231 pKa = 4.18ARR233 pKa = 11.84AFAAHH238 pKa = 6.13FRR240 pKa = 11.84EE241 pKa = 4.67KK242 pKa = 10.31MRR244 pKa = 11.84TT245 pKa = 3.39
MM1 pKa = 7.52EE2 pKa = 4.84MLEE5 pKa = 4.3GADD8 pKa = 3.6VEE10 pKa = 4.36VLEE13 pKa = 5.55DD14 pKa = 4.46IEE16 pKa = 6.08IIDD19 pKa = 4.29EE20 pKa = 4.14NPEE23 pKa = 3.91IFDD26 pKa = 3.56EE27 pKa = 4.95DD28 pKa = 4.23YY29 pKa = 11.3VDD31 pKa = 4.48NVMDD35 pKa = 3.99SVTTEE40 pKa = 3.74TLEE43 pKa = 4.75FEE45 pKa = 4.54EE46 pKa = 4.93EE47 pKa = 3.87LDD49 pKa = 3.9NNVAEE54 pKa = 4.31ASEE57 pKa = 4.29IVEE60 pKa = 4.63MPDD63 pKa = 2.45IDD65 pKa = 4.28YY66 pKa = 10.42NQVYY70 pKa = 10.65AEE72 pKa = 4.51IEE74 pKa = 4.03EE75 pKa = 4.38EE76 pKa = 4.09LNQFDD81 pKa = 6.02FDD83 pKa = 5.22DD84 pKa = 5.39LDD86 pKa = 3.35IFKK89 pKa = 11.0NEE91 pKa = 3.46EE92 pKa = 4.12HH93 pKa = 7.23LNDD96 pKa = 4.5LLDD99 pKa = 4.84GFAQSKK105 pKa = 7.12WEE107 pKa = 4.08RR108 pKa = 11.84MDD110 pKa = 3.33TLEE113 pKa = 4.76RR114 pKa = 11.84KK115 pKa = 9.25EE116 pKa = 4.54VMDD119 pKa = 4.15NLADD123 pKa = 3.87YY124 pKa = 10.41VAEE127 pKa = 4.06AVGIEE132 pKa = 4.07HH133 pKa = 6.6TPDD136 pKa = 2.47ISFYY140 pKa = 10.61YY141 pKa = 10.43NPEE144 pKa = 3.85NGDD147 pKa = 3.36YY148 pKa = 11.45GEE150 pKa = 4.32YY151 pKa = 10.79NEE153 pKa = 5.51LDD155 pKa = 3.31NKK157 pKa = 10.5IKK159 pKa = 10.64INEE162 pKa = 4.1YY163 pKa = 10.83CLDD166 pKa = 4.31DD167 pKa = 4.59SNEE170 pKa = 3.89ALDD173 pKa = 4.24TVVHH177 pKa = 5.84EE178 pKa = 4.99LWHH181 pKa = 5.94SYY183 pKa = 7.4QRR185 pKa = 11.84QRR187 pKa = 11.84ASNPQTAKK195 pKa = 10.75DD196 pKa = 3.51YY197 pKa = 10.37QYY199 pKa = 11.22QYY201 pKa = 11.71NFDD204 pKa = 4.2HH205 pKa = 6.83YY206 pKa = 10.71IEE208 pKa = 4.63PLKK211 pKa = 11.1GPDD214 pKa = 3.34GNYY217 pKa = 10.24VNIINYY223 pKa = 8.94EE224 pKa = 4.0EE225 pKa = 3.95QLVEE229 pKa = 4.0VEE231 pKa = 4.18ARR233 pKa = 11.84AFAAHH238 pKa = 6.13FRR240 pKa = 11.84EE241 pKa = 4.67KK242 pKa = 10.31MRR244 pKa = 11.84TT245 pKa = 3.39
Molecular weight: 28.9 kDa
Isoelectric point according different methods:
Protein with the highest isoelectric point:
>tr|G5I979|G5I979_9CLOT Uncharacterized protein OS=Hungatella hathewayi WAL-18680 OX=742737 GN=HMPREF9473_00069 PE=3 SV=1
MM1 pKa = 7.67KK2 pKa = 8.72MTFQPKK8 pKa = 8.41KK9 pKa = 7.5RR10 pKa = 11.84QRR12 pKa = 11.84ARR14 pKa = 11.84VHH16 pKa = 6.02GFRR19 pKa = 11.84ARR21 pKa = 11.84MSSPGGRR28 pKa = 11.84KK29 pKa = 8.91VLAARR34 pKa = 11.84RR35 pKa = 11.84AKK37 pKa = 10.33GRR39 pKa = 11.84AKK41 pKa = 10.69LSAA44 pKa = 3.92
MM1 pKa = 7.67KK2 pKa = 8.72MTFQPKK8 pKa = 8.41KK9 pKa = 7.5RR10 pKa = 11.84QRR12 pKa = 11.84ARR14 pKa = 11.84VHH16 pKa = 6.02GFRR19 pKa = 11.84ARR21 pKa = 11.84MSSPGGRR28 pKa = 11.84KK29 pKa = 8.91VLAARR34 pKa = 11.84RR35 pKa = 11.84AKK37 pKa = 10.33GRR39 pKa = 11.84AKK41 pKa = 10.69LSAA44 pKa = 3.92
Molecular weight: 4.98 kDa
Isoelectric point according different methods:
Peptides (in silico digests for buttom-up proteomics)
Below you can find in silico digests of the whole proteome with Trypsin, Chymotrypsin, Trypsin+LysC, LysN, ArgC proteases suitable for different mass spec machines.| Try ESI |
 |
|---|
| ChTry ESI |
 |
|---|
| ArgC ESI |
 |
|---|
| LysN ESI |
 |
|---|
| TryLysC ESI |
 |
|---|
| Try MALDI |
 |
|---|
| ChTry MALDI |
 |
|---|
| ArgC MALDI |
 |
|---|
| LysN MALDI |
 |
|---|
| TryLysC MALDI |
 |
|---|
| Try LTQ |
 |
|---|
| ChTry LTQ |
 |
|---|
| ArgC LTQ |
 |
|---|
| LysN LTQ |
 |
|---|
| TryLysC LTQ |
 |
|---|
| Try MSlow |
 |
|---|
| ChTry MSlow |
 |
|---|
| ArgC MSlow |
 |
|---|
| LysN MSlow |
 |
|---|
| TryLysC MSlow |
 |
|---|
| Try MShigh |
 |
|---|
| ChTry MShigh |
 |
|---|
| ArgC MShigh |
 |
|---|
| LysN MShigh |
 |
|---|
| TryLysC MShigh |
 |
|---|
General Statistics
Number of major isoforms |
Number of additional isoforms |
Number of all proteins |
Number of amino acids |
Min. Seq. Length |
Max. Seq. Length |
Avg. Seq. Length |
Avg. Mol. Weight |
|---|---|---|---|---|---|---|---|
0 |
1708591 |
21 |
4185 |
330.7 |
36.8 |
Amino acid frequency
Ala |
Cys |
Asp |
Glu |
Phe |
Gly |
His |
Ile |
Lys |
Leu |
|---|---|---|---|---|---|---|---|---|---|
7.865 ± 0.038 | 1.451 ± 0.013 |
5.405 ± 0.028 | 7.515 ± 0.045 |
3.939 ± 0.03 | 8.011 ± 0.058 |
1.686 ± 0.017 | 6.84 ± 0.034 |
5.676 ± 0.033 | 8.948 ± 0.044 |
Met |
Asn |
Gln |
Pro |
Arg |
Ser |
Thr |
Val |
Trp |
Tyr |
|---|---|---|---|---|---|---|---|---|---|
3.287 ± 0.023 | 4.13 ± 0.024 |
3.532 ± 0.021 | 3.232 ± 0.02 |
4.617 ± 0.031 | 5.97 ± 0.034 |
5.634 ± 0.036 | 7.115 ± 0.032 |
1.044 ± 0.012 | 4.104 ± 0.021 |
Most of the basic statistics you can see at this page can be downloaded from this CSV file
Proteome-pI is available under Creative Commons Attribution-NoDerivs license, for more details see here
| Reference: Kozlowski LP. Proteome-pI 2.0: Proteome Isoelectric Point Database Update. Nucleic Acids Res. 2021, doi: 10.1093/nar/gkab944 | Contact: Lukasz P. Kozlowski |
